


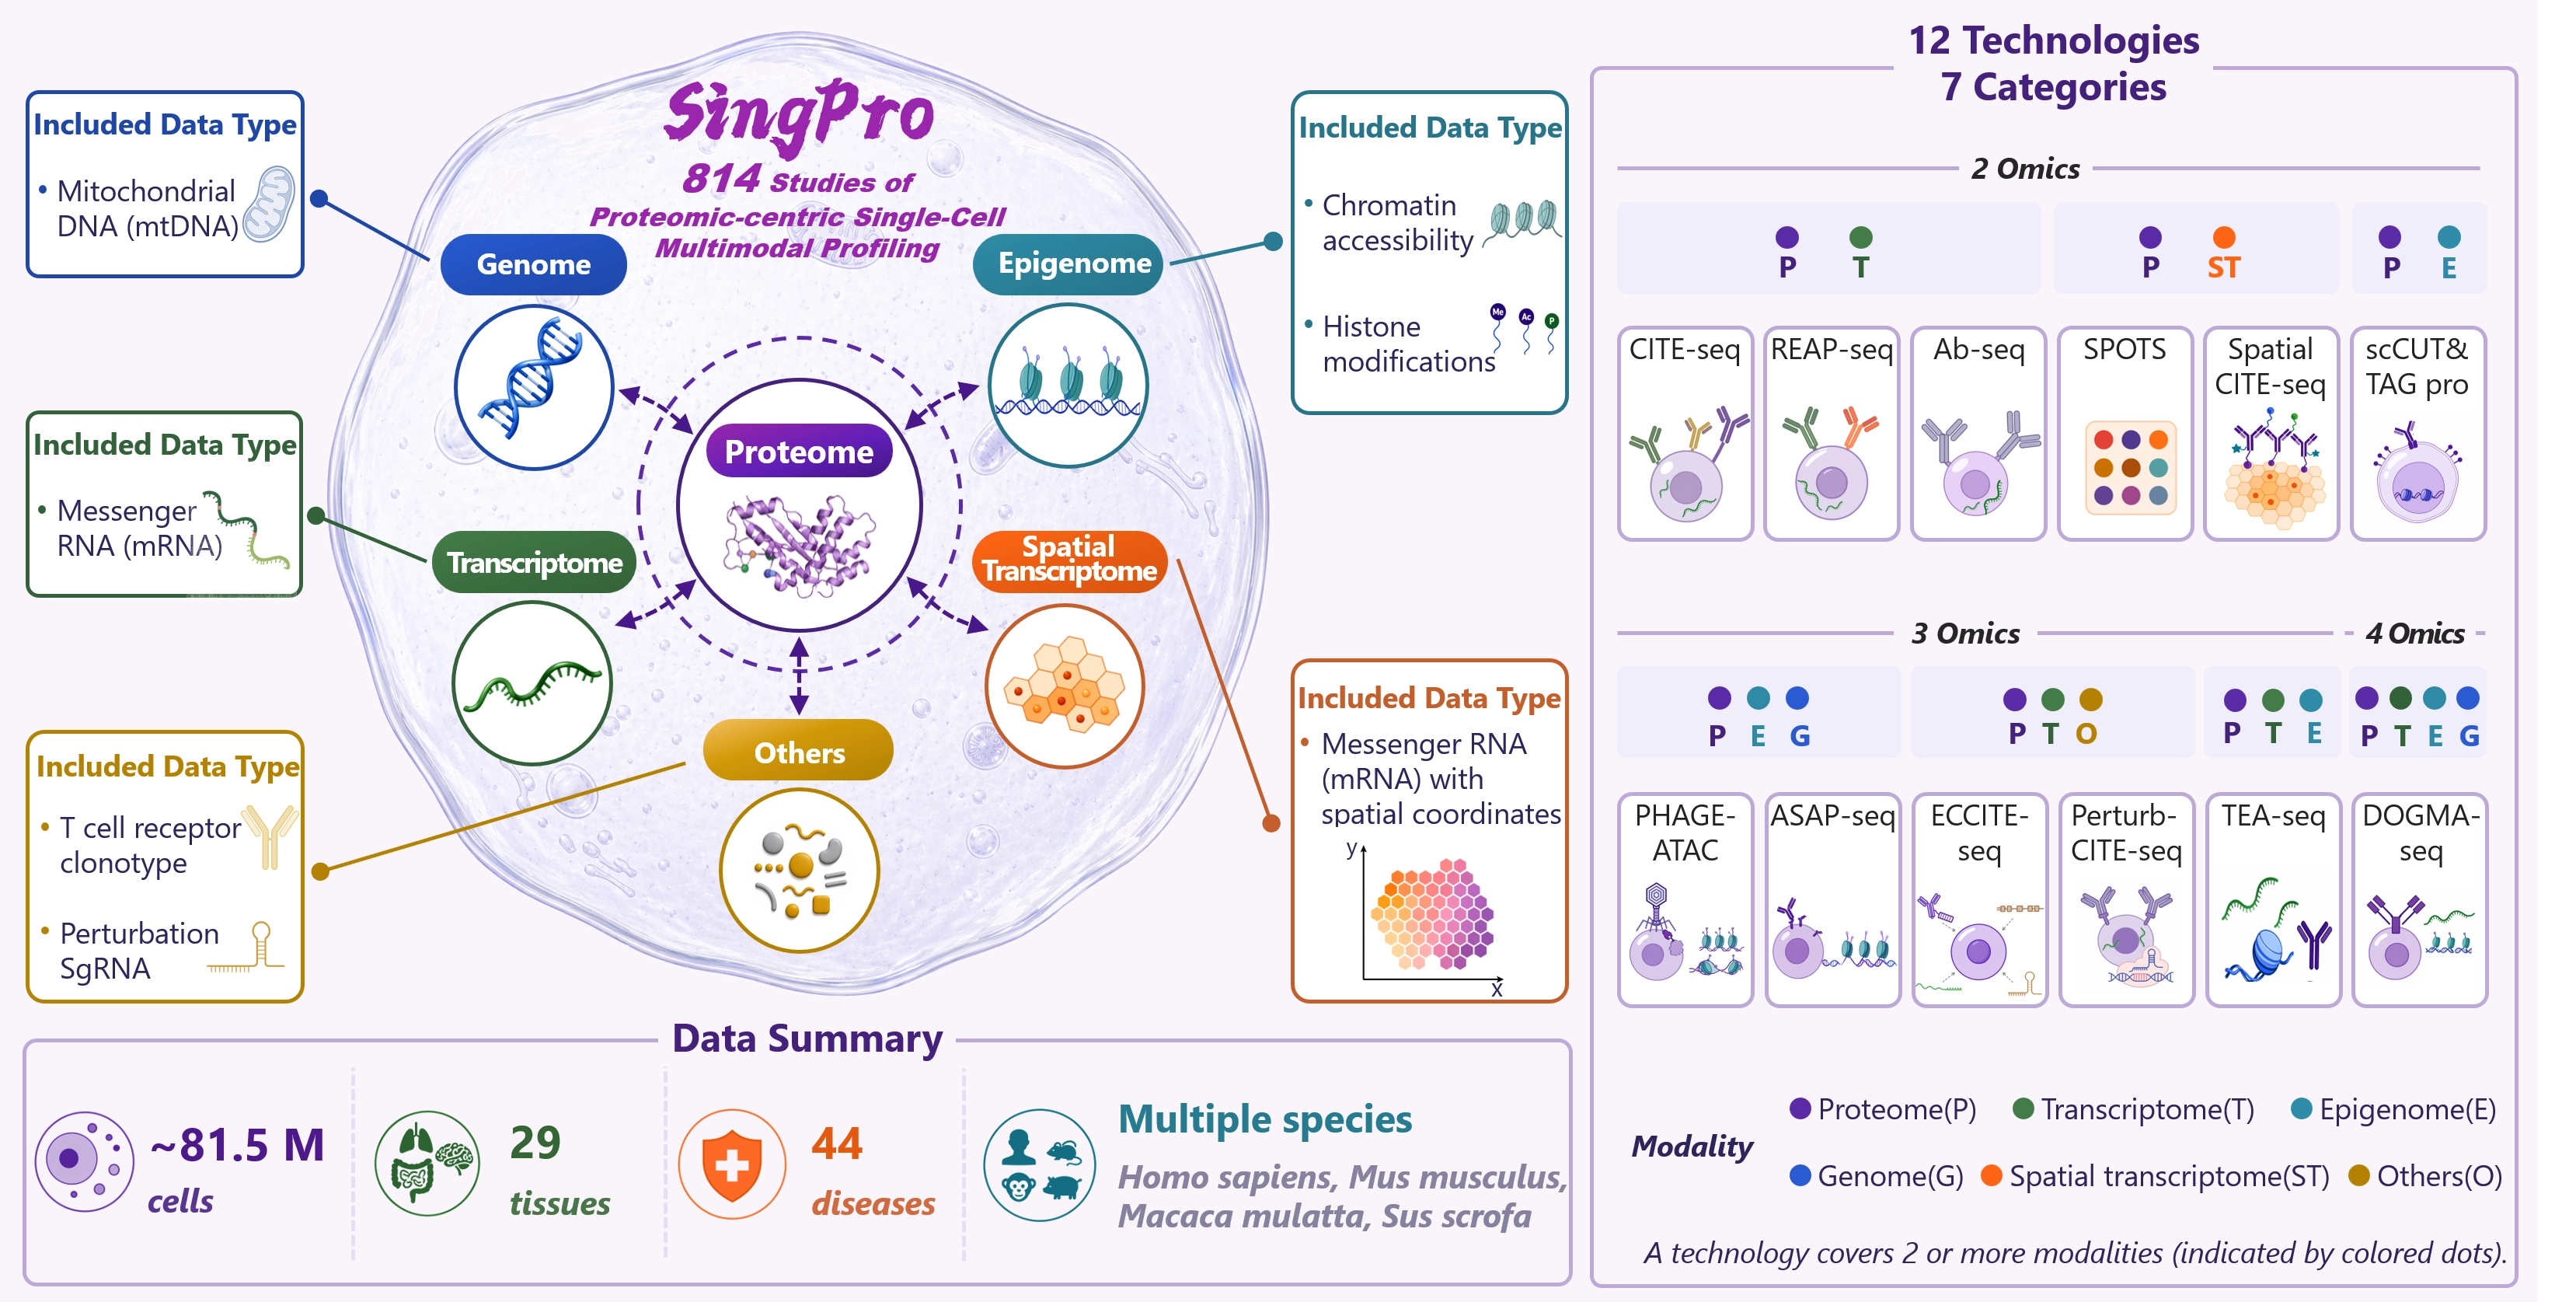
1.1. Search for single-cell multimodal omics (SCM) and single-cell proteomic (SCP) data
At the top of the SingPro home page, a quick-search box allows users to retrieve datasets by entering a project ID, disease, cell line, tissue, experimental method, modality, quantitative methods, or another characteristic of interest. In addition, the quick-search box supports multi-keyword queries, in which multiple keywords can be joined with plus signs (+), semicolons (;), commas (,), or spaces. Synonym-based searching is likewise supported. For example, searches for ‘PBMC’ and ‘peripheral blood mononuclear cells’ now retrieve the same set of relevant records.
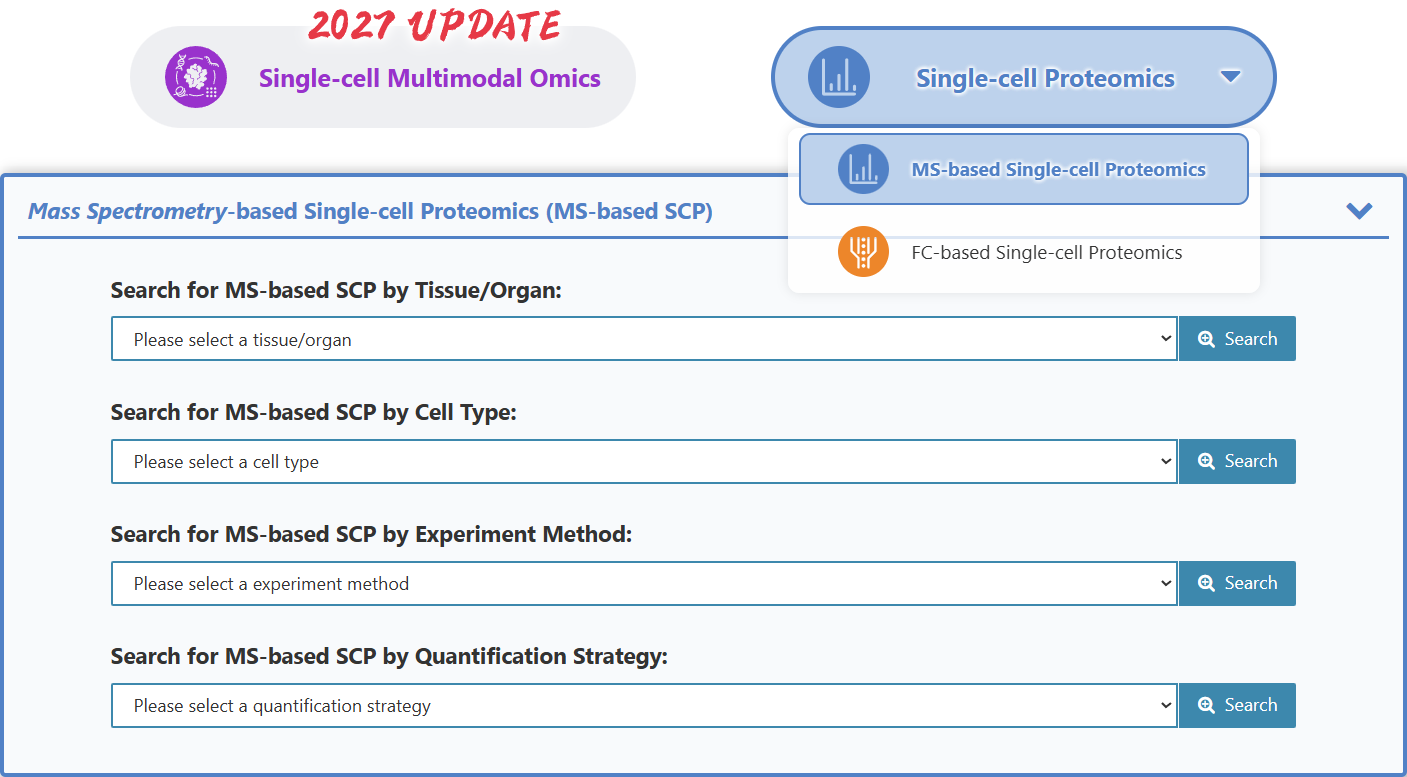
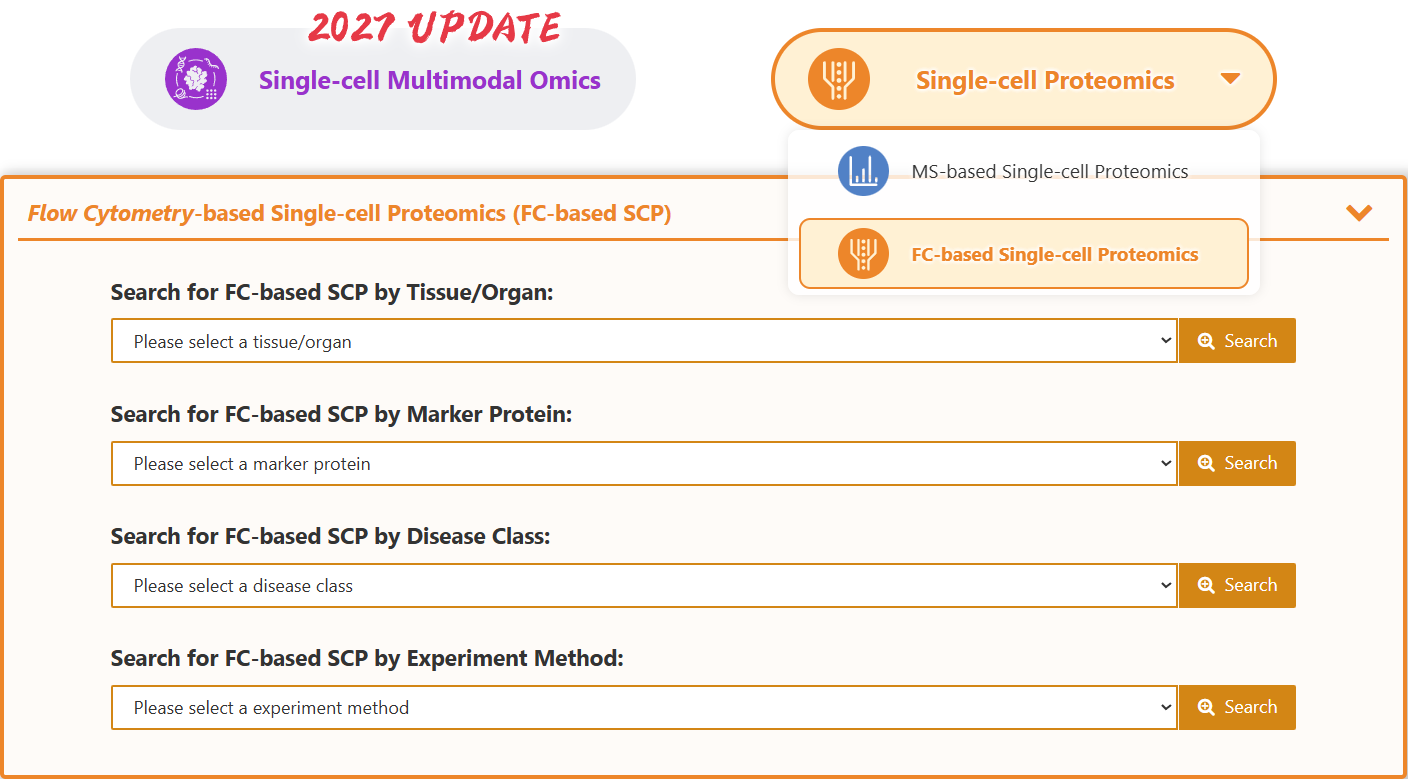
Below the quick-search box, users can choose between two main data categories. Selecting the ‘Protein-Inclusive Single-cell Multimodal Omics’ button displays search options for multimodal studies that include proteomic measurements. Selecting the ‘Single-cell Proteomics’ button allows users to further choose between mass spectrometry-based single-cell proteomics (MS-SCP) and flow cytometry-based single-cell proteomics (FC-SCP).
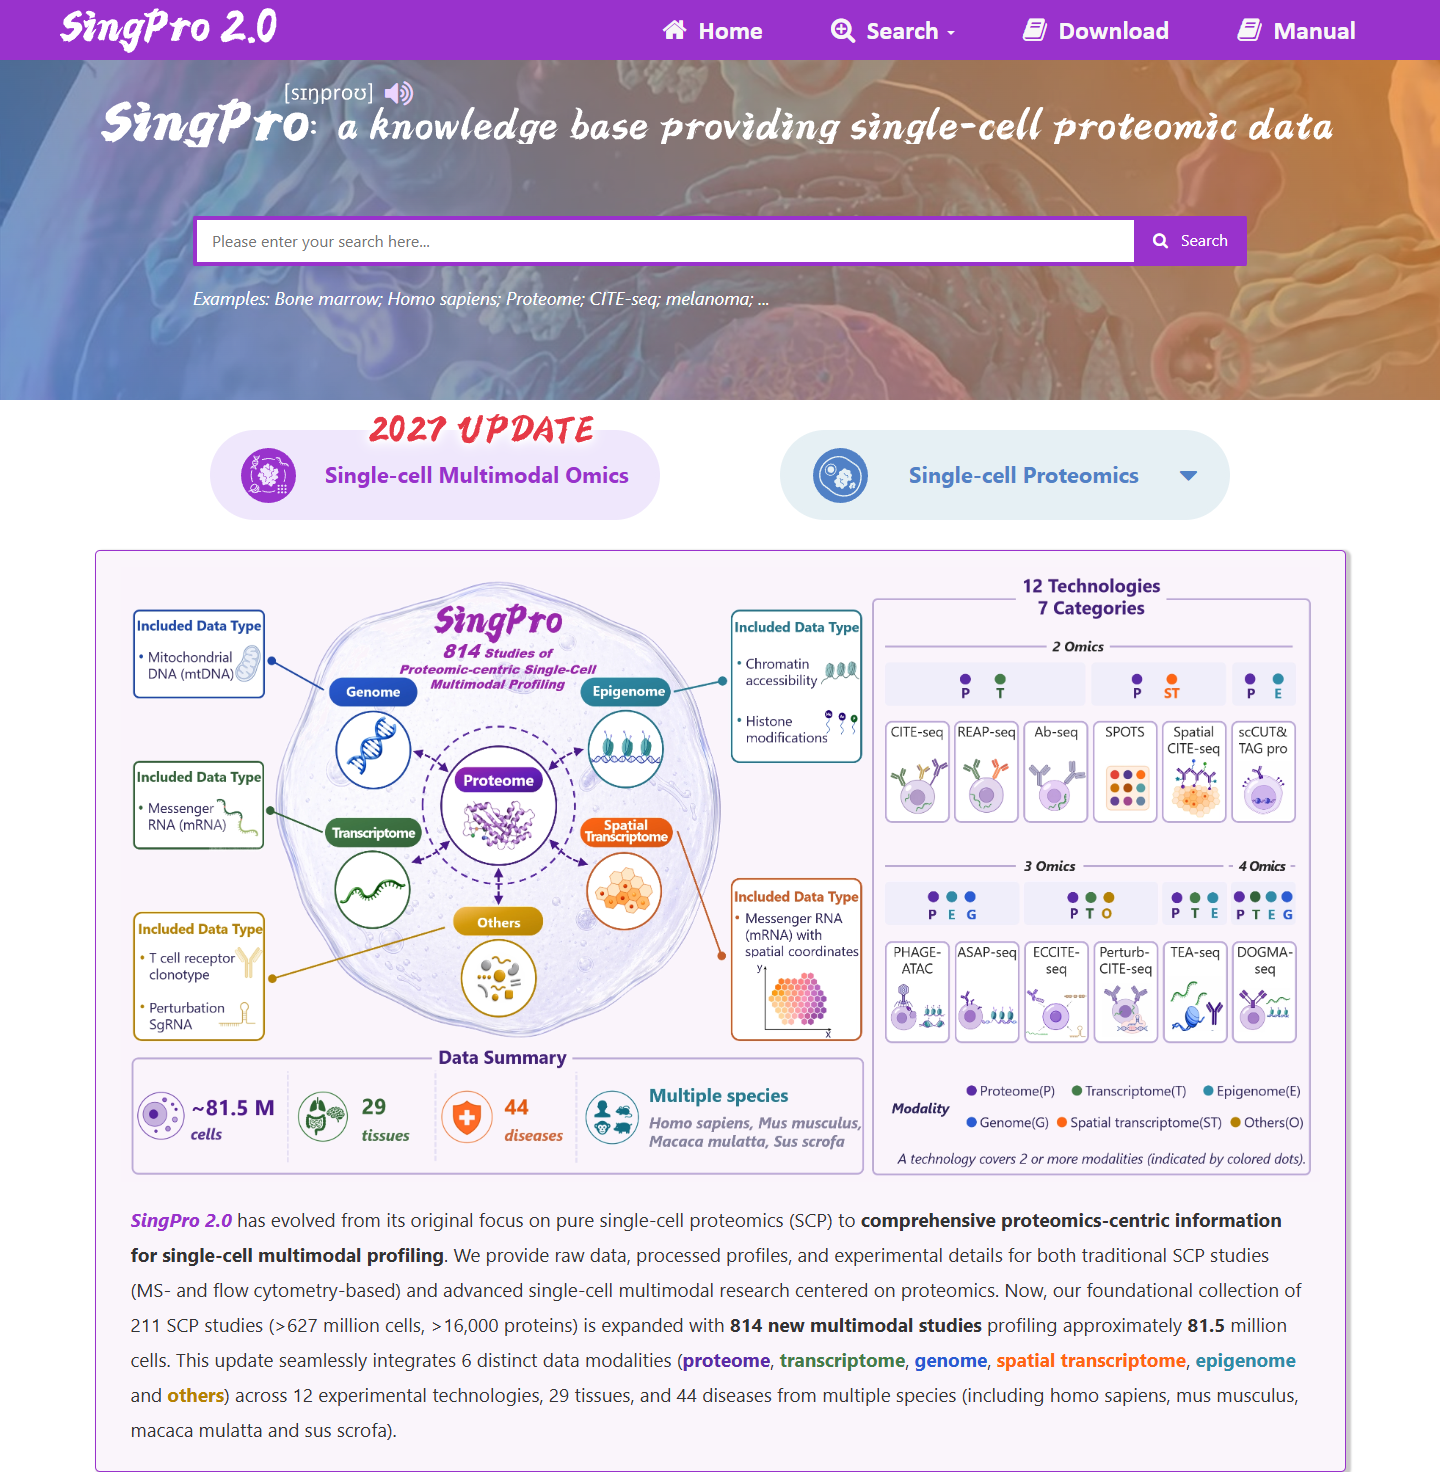
Each category provides search fields tailored to its data type. The multimodal omics panel supports searches by experimental method, disease class, tissue/organ, and modality. The MS-SCP and FC-SCP panels provide dedicated drop-down menus for relevant criteria, including tissue/organ, cell type, disease class, experimental method, and quantification strategy.
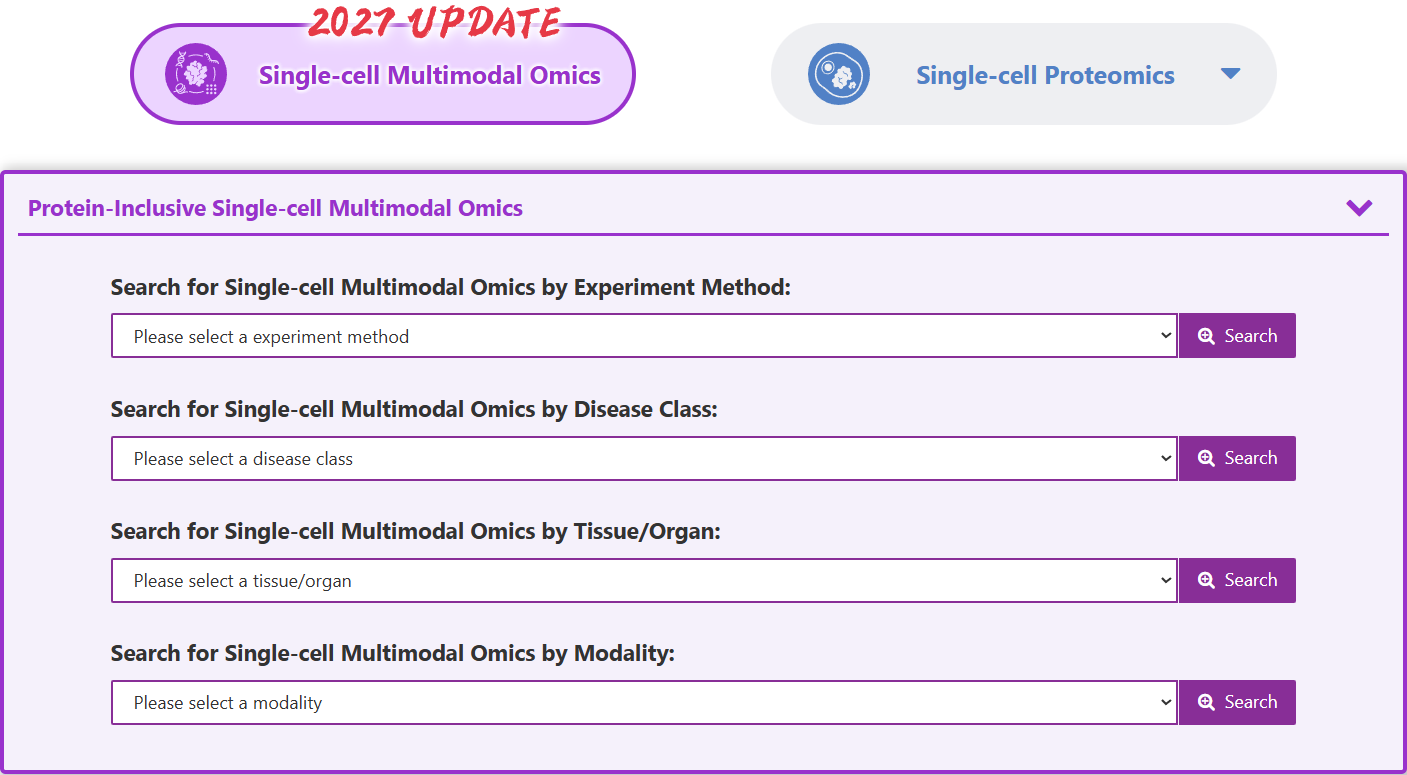
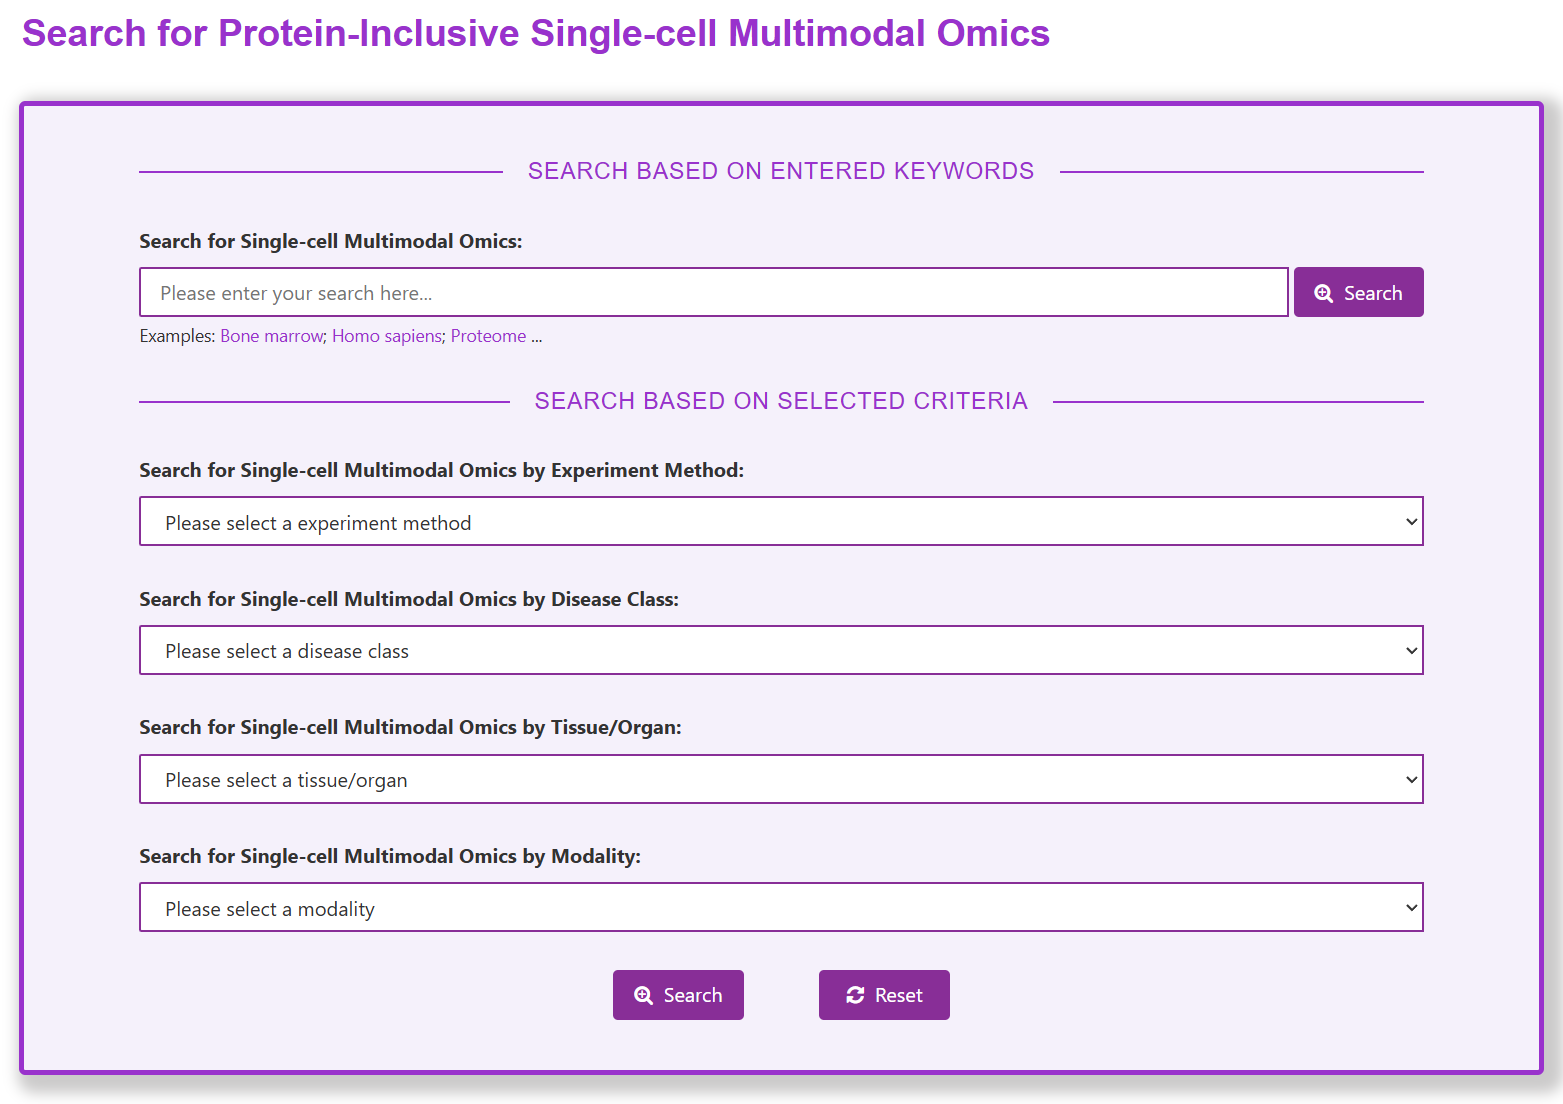
Beyond the quick search, SingPro provides a dedicated advanced search page for single-cell multimodal omics (SCM) data, available at https://singpro2027.idrblab.net/search/mo. On this page, a keyword box accepts one or more keywords characterizing the datasets of interest, and four drop-down menus support searches by experiment method, disease class, tissue/organ, and modality. Through the combined search, users can apply multiple criteria within a single query, and only the datasets that satisfy all of the selected criteria are returned. The Search button submits the query, and the Reset button clears the entered keywords and the selected criteria.
1.2. Result of data search
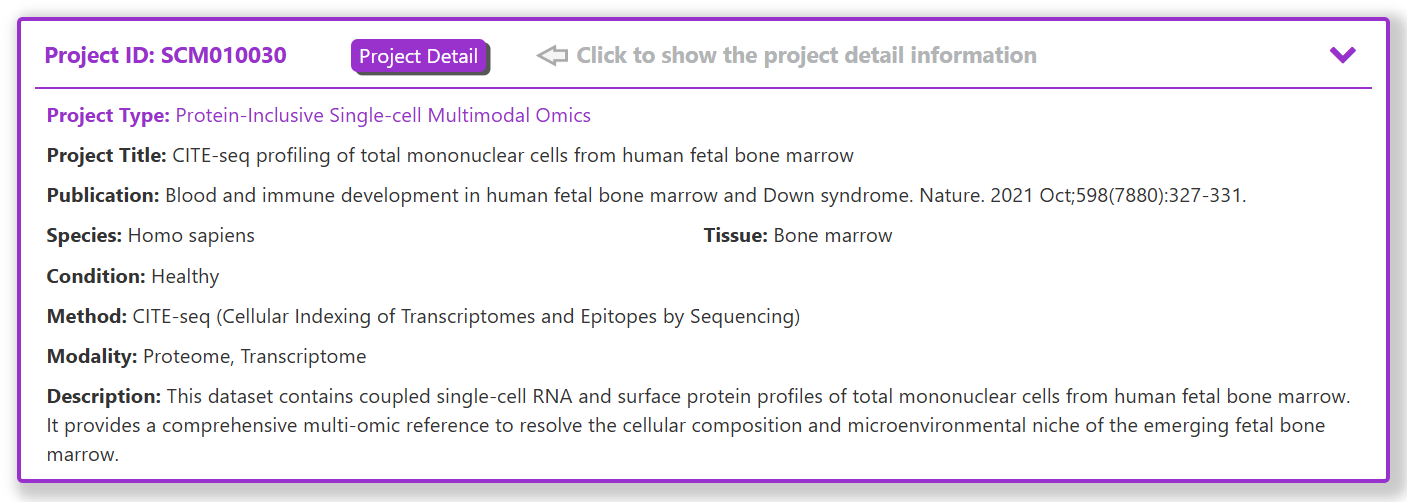
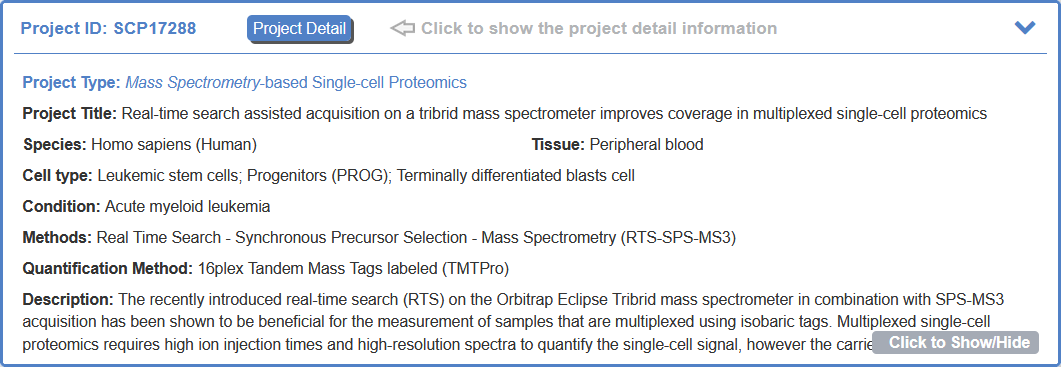
Search results are displayed as project cards. SCM, MS-based SCP, and FC-based SCP projects are distinguished by their project type and color scheme. Each card summarizes the project ID, title, species, tissue, condition, experimental method, and description. In addition, SCM cards display the publication, included modalities, MS-SCP cards present the quantification method, and FC-SCP cards list the marker proteins. User can see detailed description of the study by clicking the ‘Project Detail’.
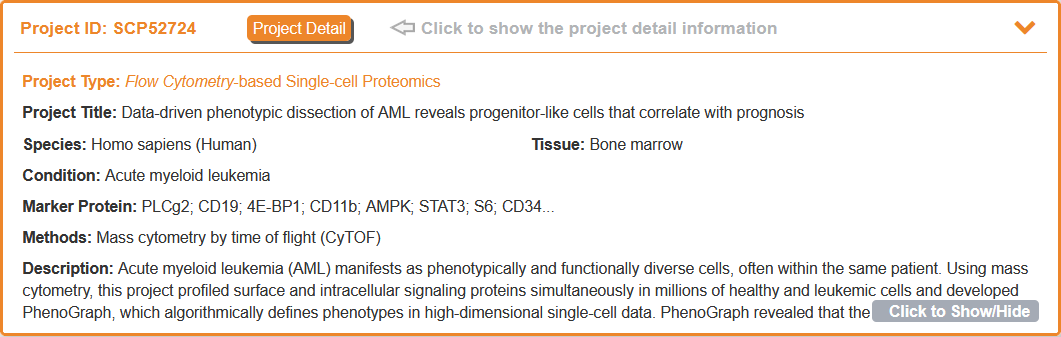
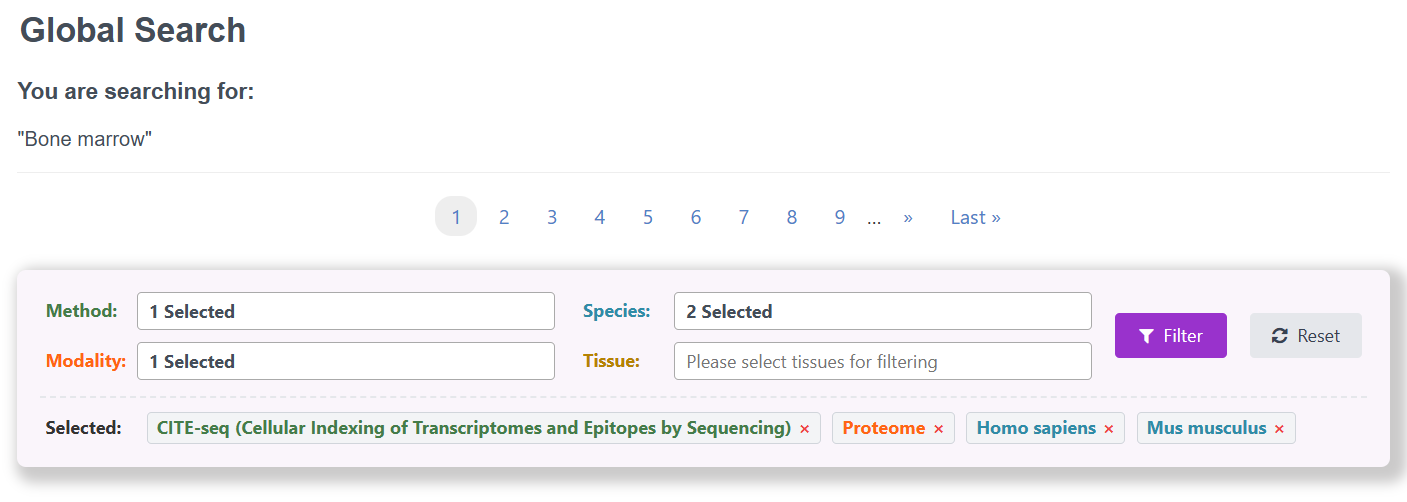
Moreover, SingPro provides filtering options to further refine the search results. Four drop-down menus (method, species, modality, and tissue) are provided above the result list, each of which supports the selection of multiple values. The chosen terms are displayed as removable tags, allowing individual criteria to be removed at any time. The Filter button applies the active criteria to the current results, and the Reset button restores the unfiltered result list.
Each SCM project page is organized into general project metadata, biological and experimental information, multimodal downstream analysis and visualization, downloadable project files, and similar studies.
2.1. General information for SCM
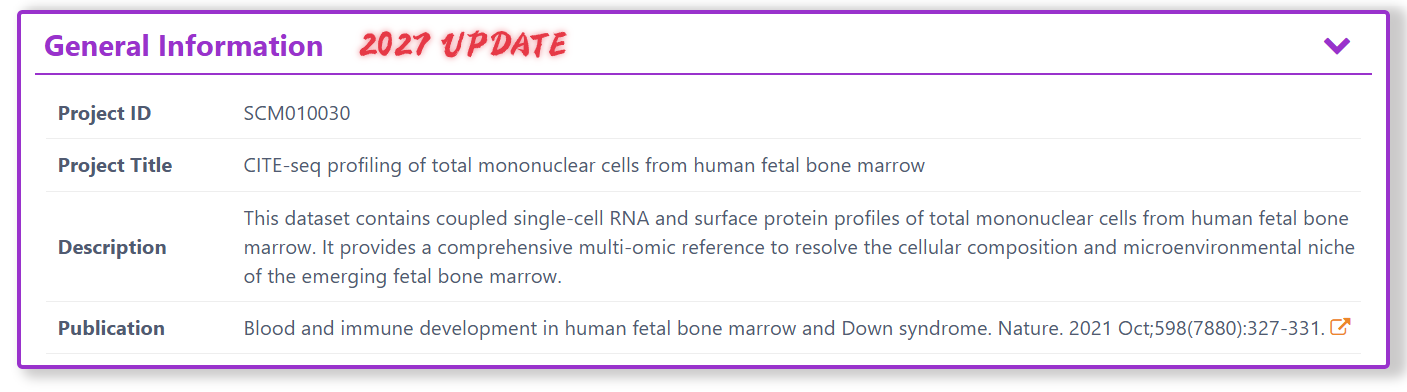
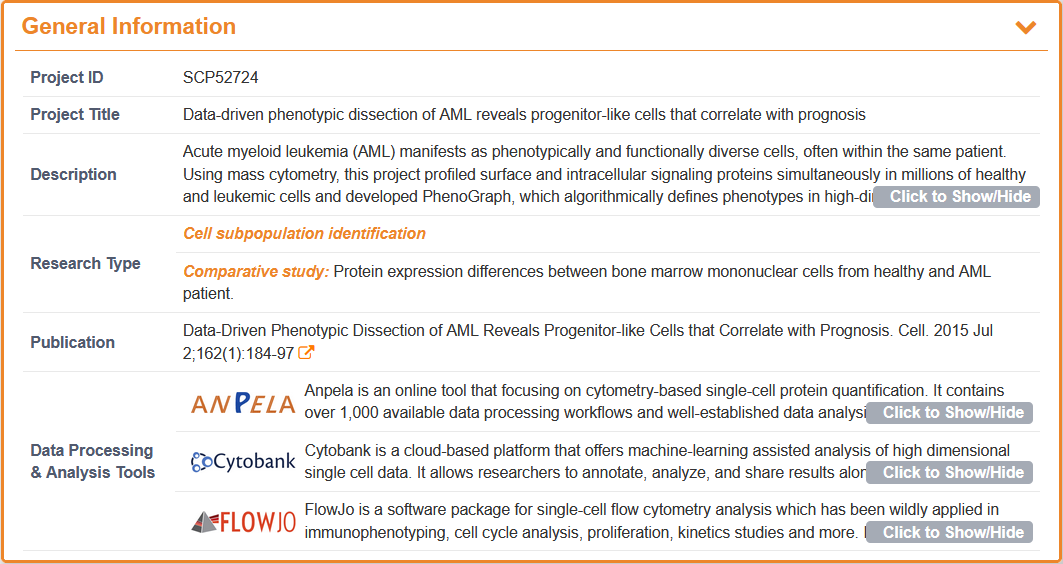
The General Information section reports the project ID, project title, description, research type, and a publication link.
2.2. Description of biological samples and experimental procedure for SCM
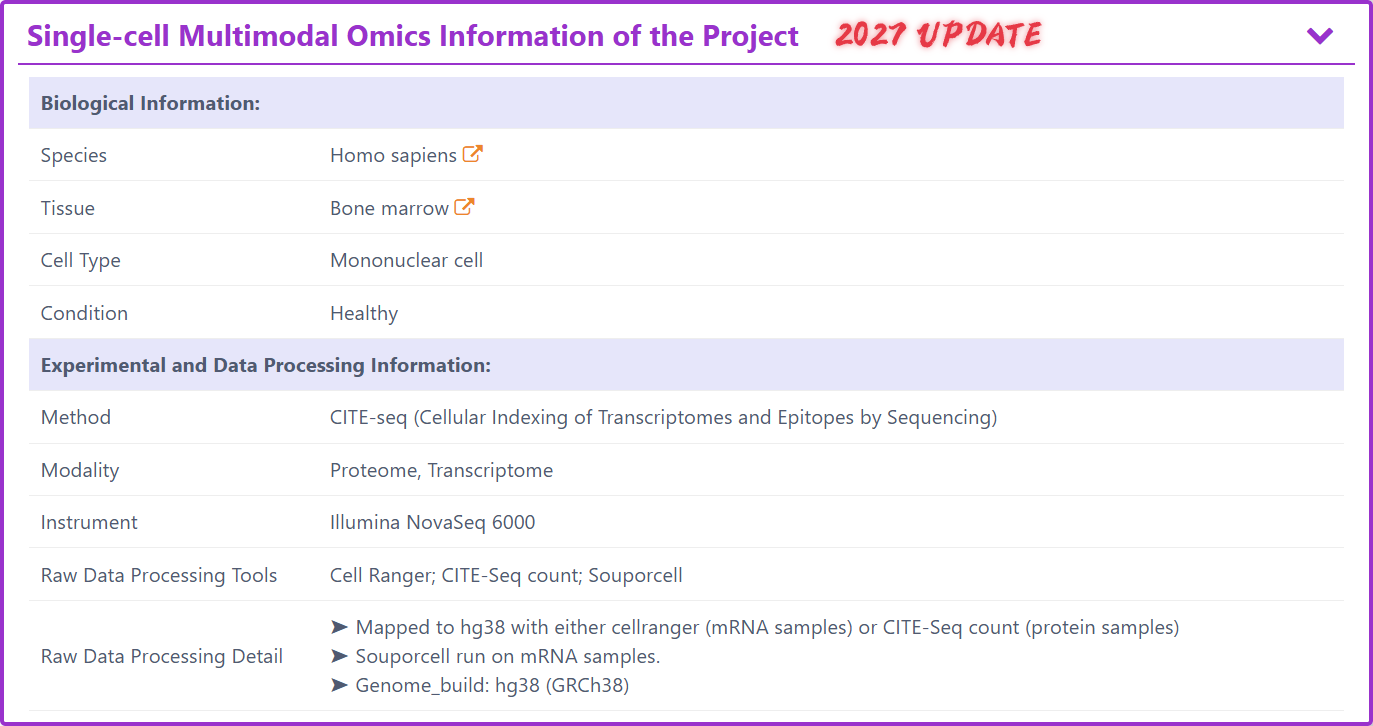
The Single-cell Multimodal Omics Information section contains two groups of metadata. Biological Information describes the species, tissue, cell type, and physiological or pathological condition. Experimental and Data Processing Information reports the multimodal method, included modalities, sequencing instrument, raw data processing tools, and processing details.
2.3. Downstream analysis and visualization of SCM
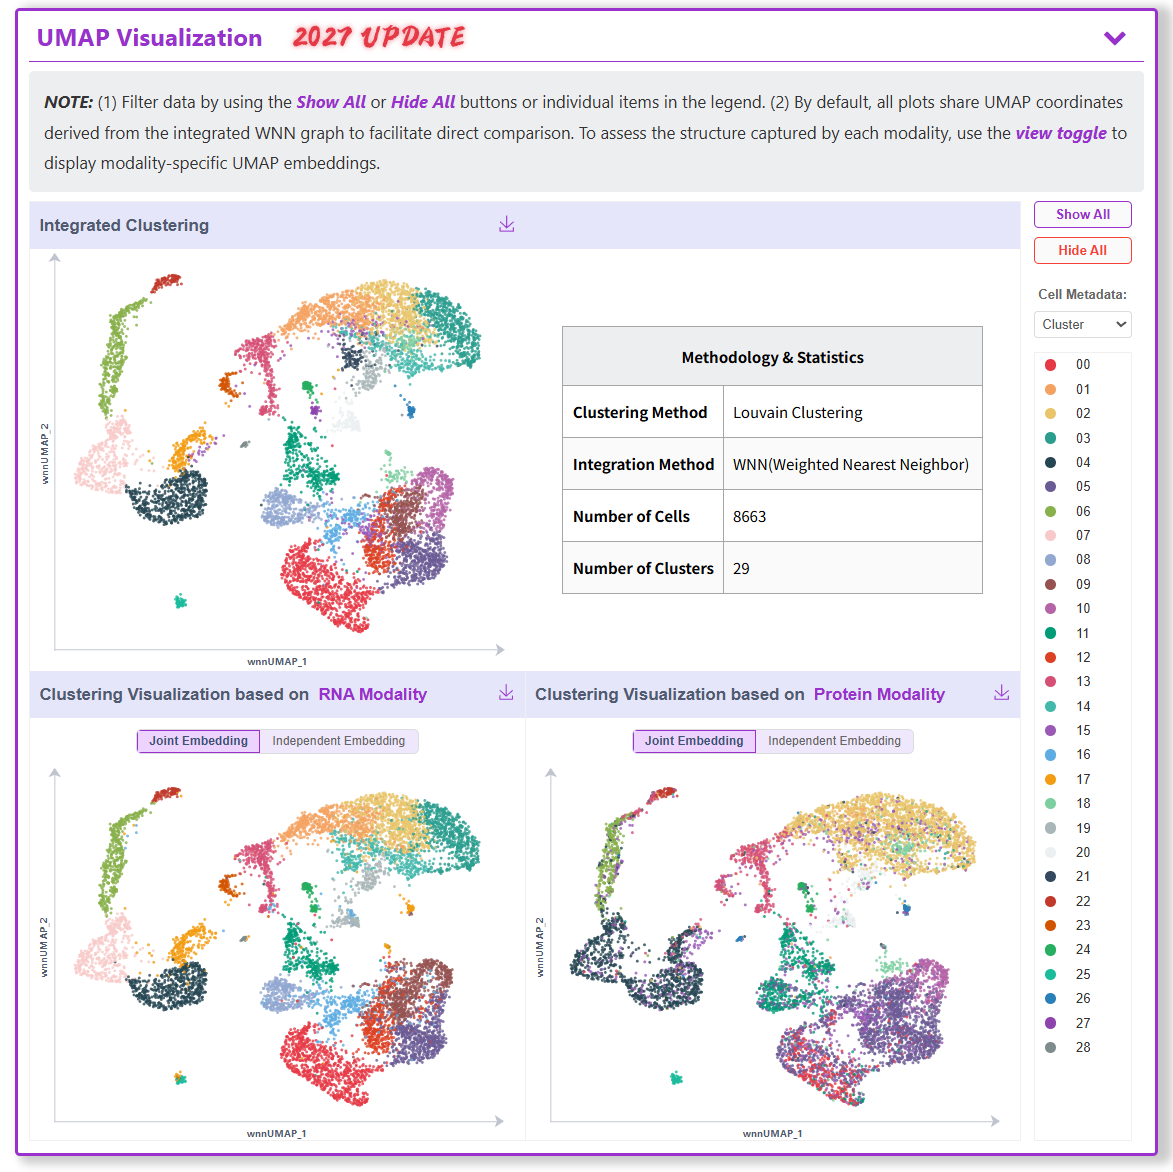
SingPro provides interactive downstream analyses that connect the modalities collected in each SCM project. ‘UMAP Visualization’ presents integrated clustering together with modality-specific views. Users can filter displayed groups through legend controls and compare clusters across different modalities. By default, all plots share UMAP coordinates derived from the integrated WNN graph to facilitate direct comparison. To assess the structure captured by each modality, use the view toggle to display modality-specific UMAP embeddings.
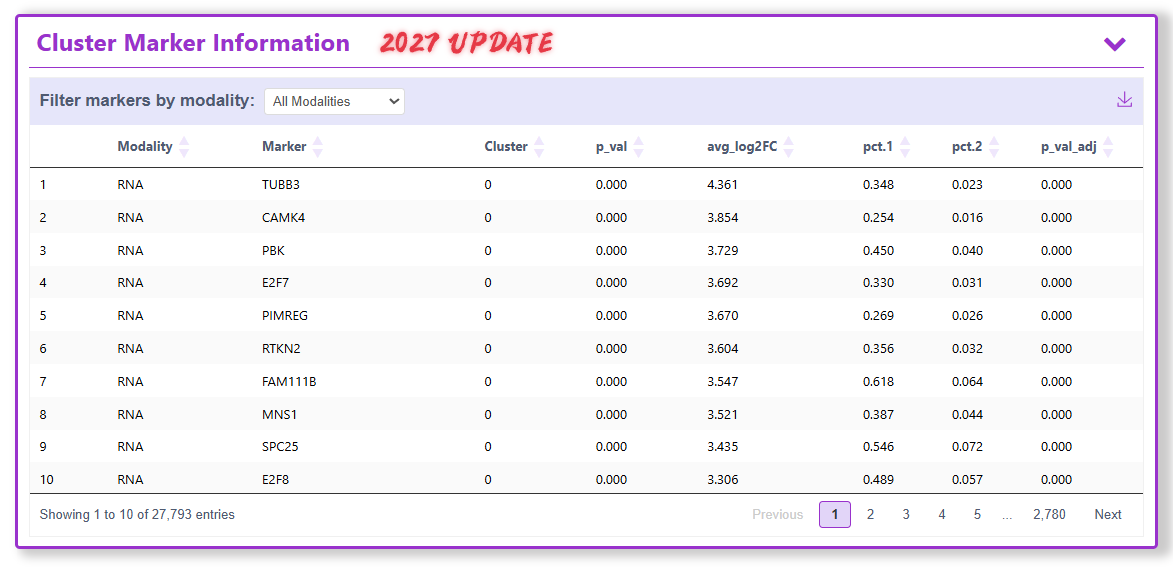
‘Cluster Marker Information’ presents markers for each cluster identified by Seurat’s FindAllMarkers function from the modalities available in each dataset (RNA, protein and/or chromatin accessibility) in a table. This module enables users to inspect representative marker information for each cluster and facilitates interpretation of the clustering results.
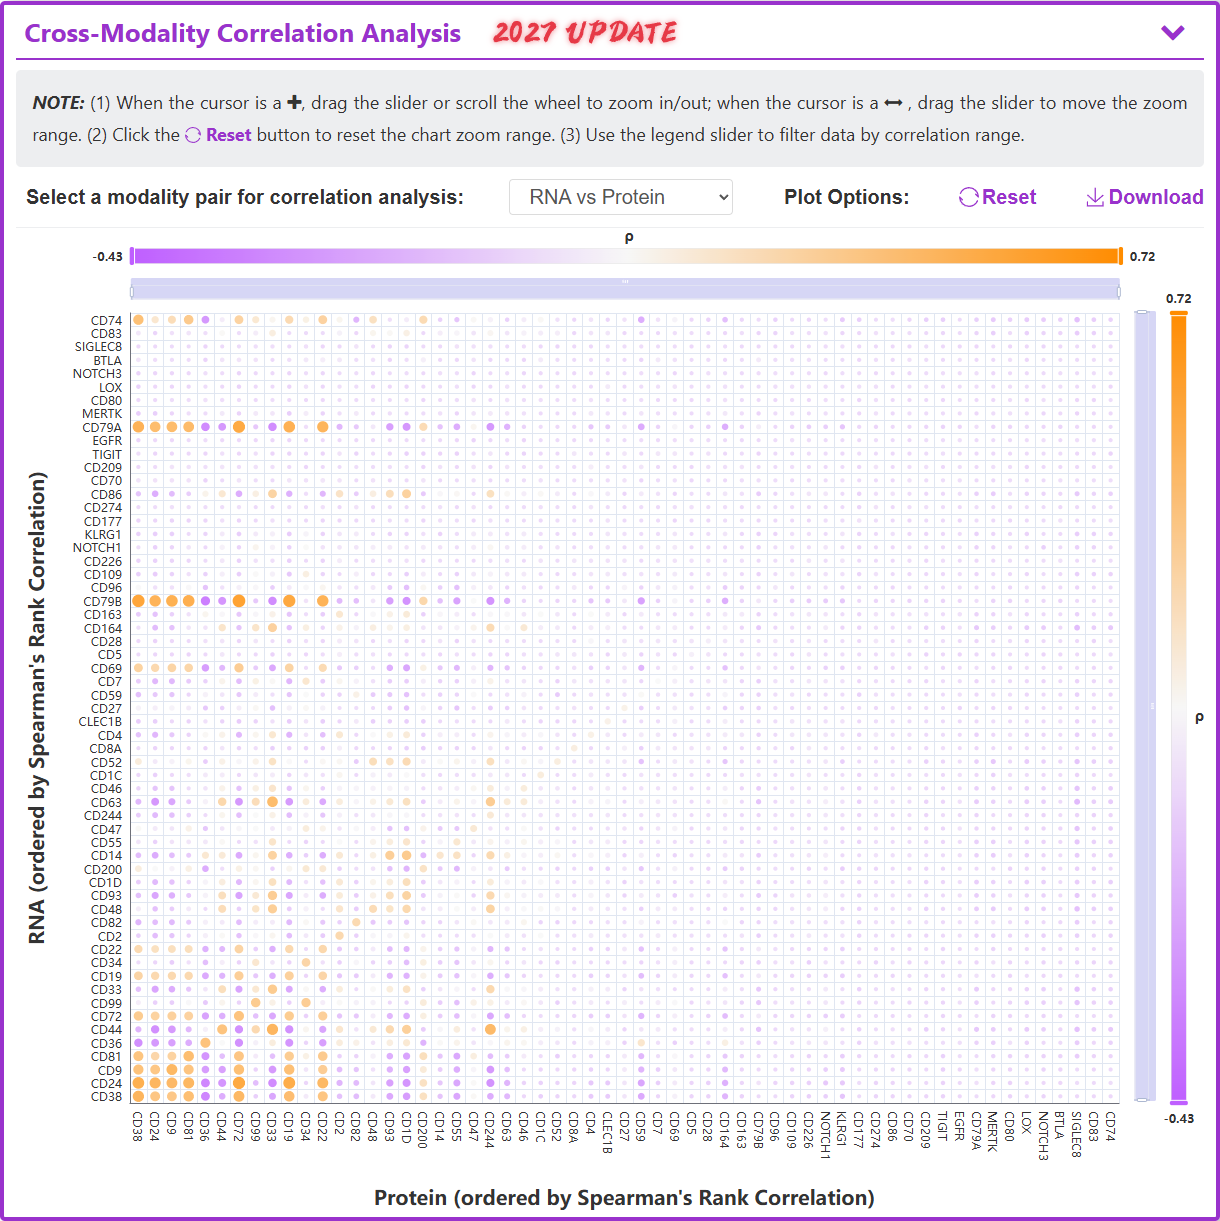
‘Cross-modality Correlation Analysis’ helps users inspect associations between protein-level and non-protein-level measurements. The interface supports modality-pair selection, zooming, reset, download, and legend-based filtering by correlation range.
3.1. Description of flow cytometry-based single-cell proteomics
3.1.1. General information for FC-SCP
For each FC-SCP project, the upper section of the project page provides the project ID, project title, description, research type, publication link, and a brief introduction and links to established data-processing and analysis tools such as Anpela, Cytobank, and FlowJo.
3.1.2. Description of biological samples and experimental procedure for FC-SCP
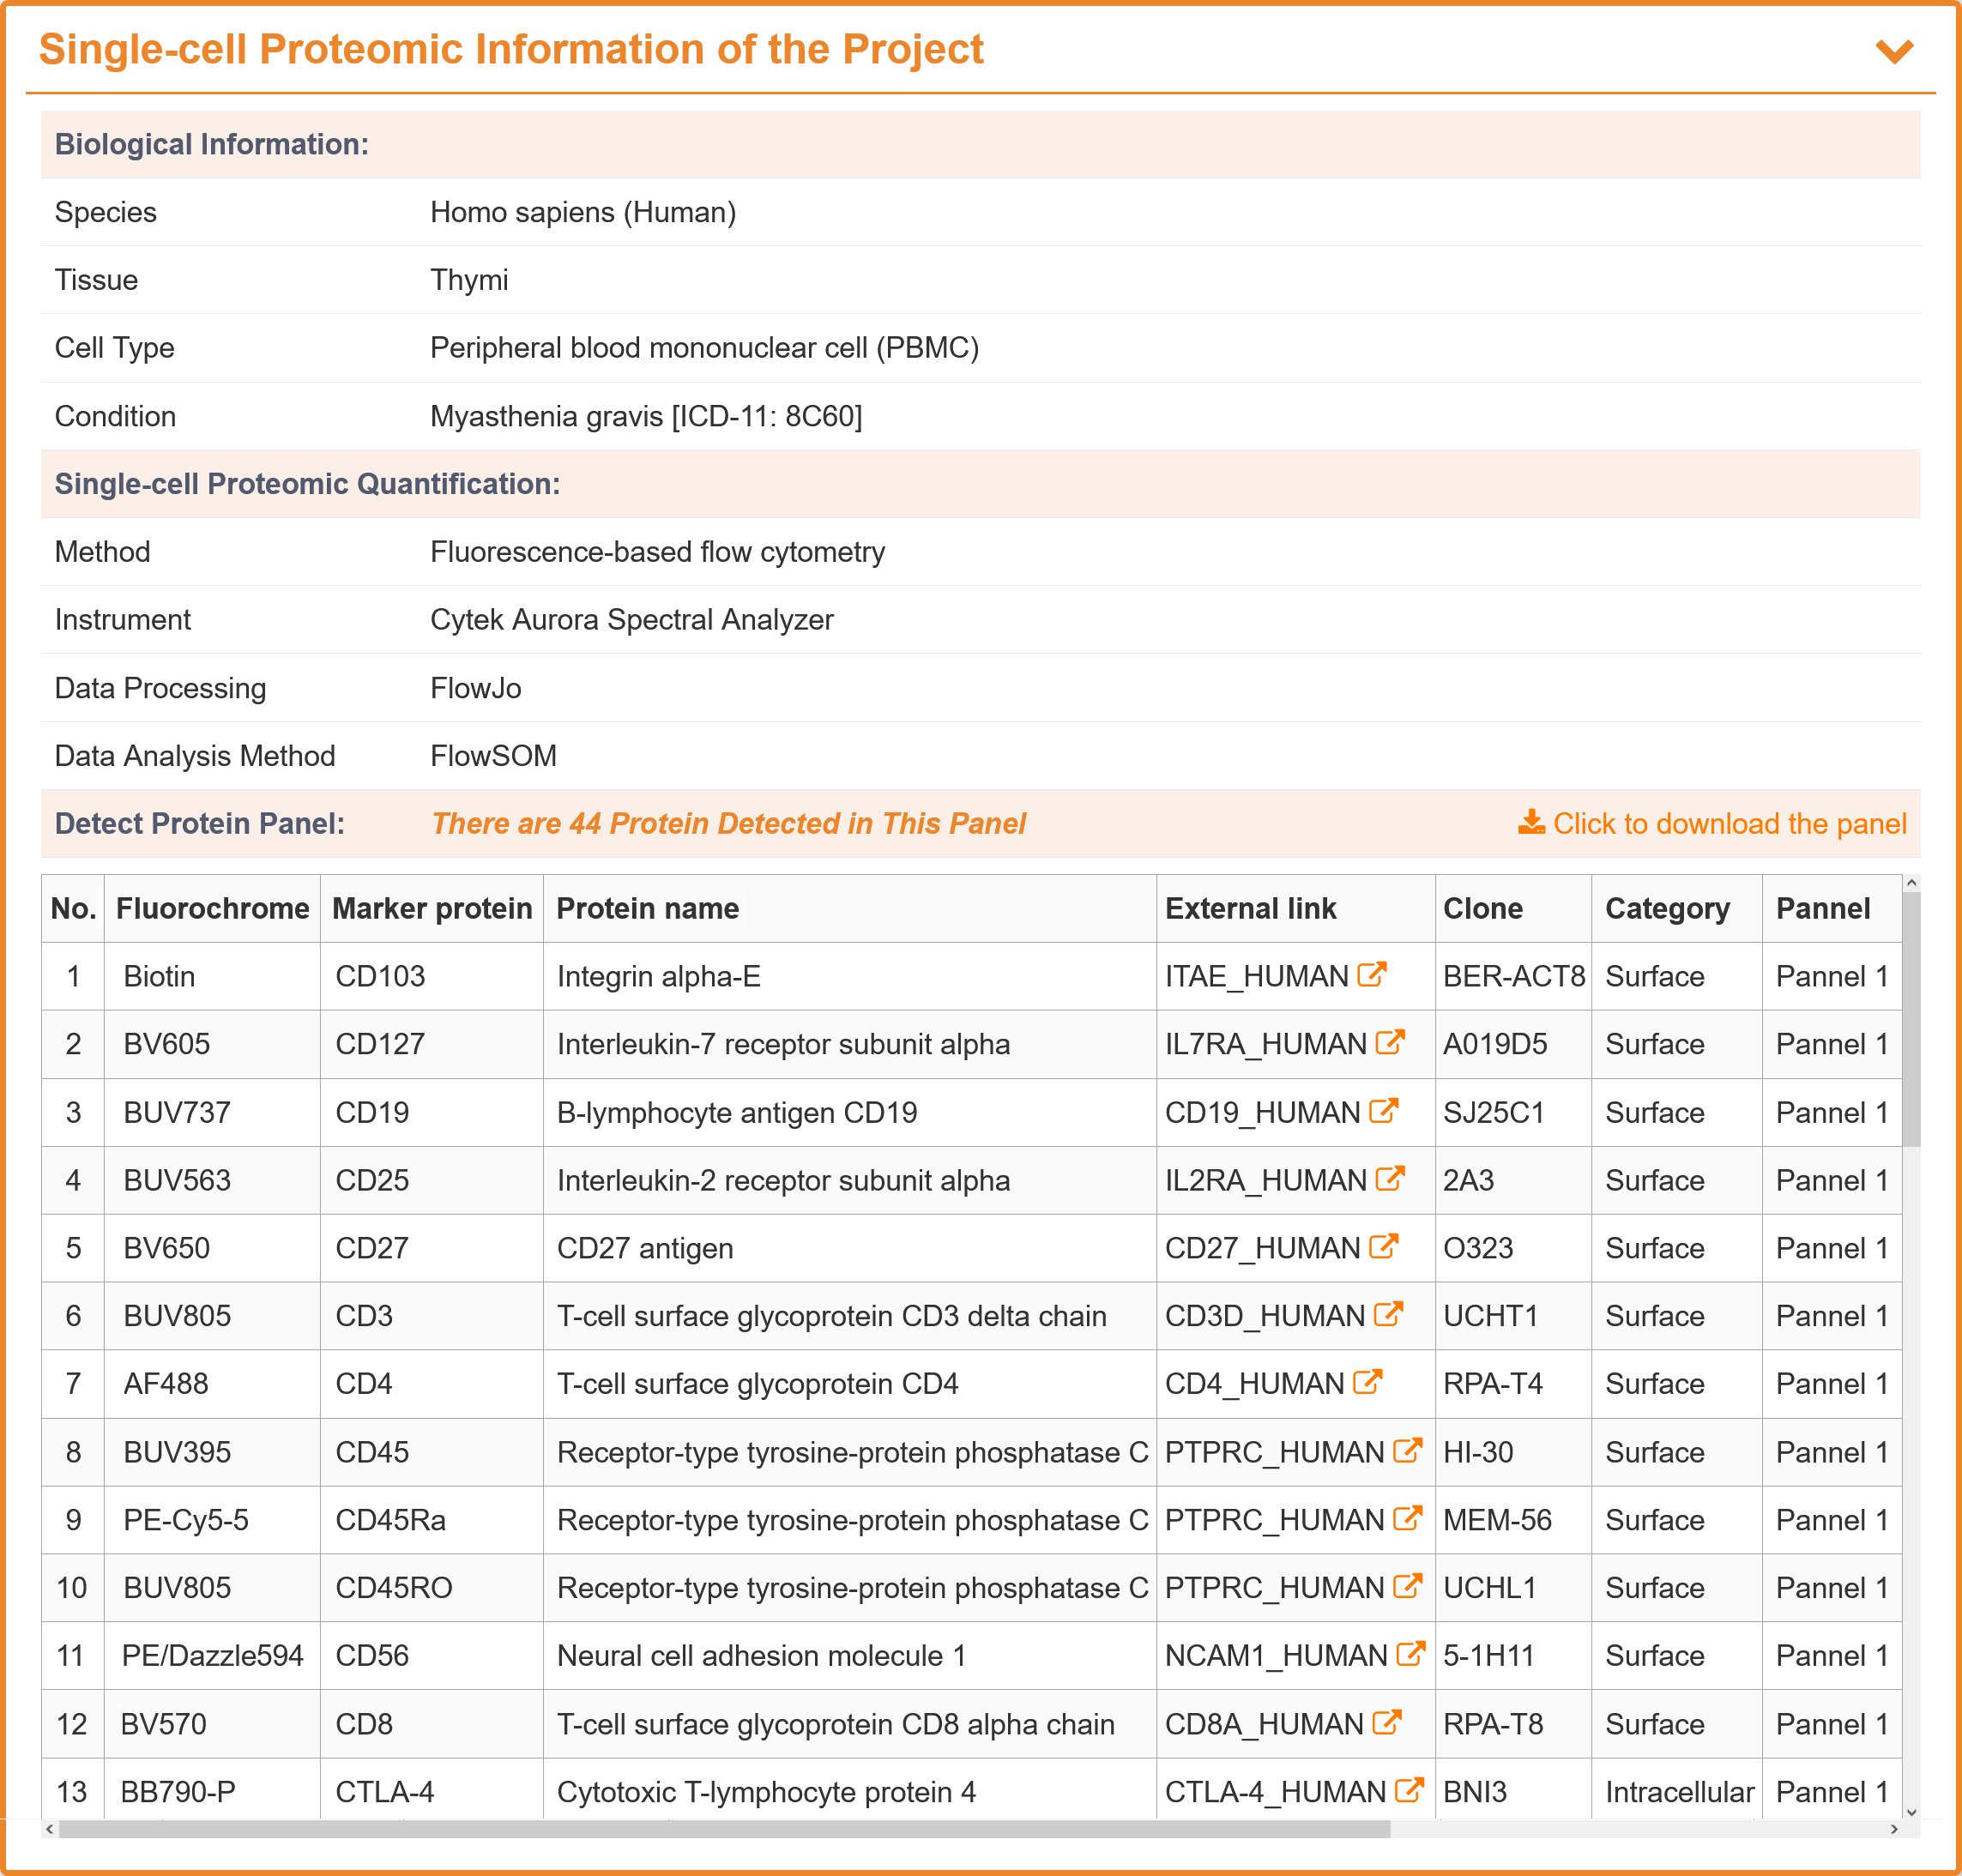
The following is a detailed description of the experimental process. A typical SingPro page describing the quantification process for flow cytometry-based SCP. Each page is carefully organized into three sections: Biological Information (studied species, experiment tissue/organ, analyzed cell type, pathological/physiological conditions, etc.), Single-cell Proteomic Quantification (applied quantification approach, experimental platform, methods for data processing and analysis, etc.), and Protein Panel (fluorochrome, protein marker, external link, clone, category (surface/intracellular) and panel number).
3.1.3. Protein expression differences of FC-based SCP
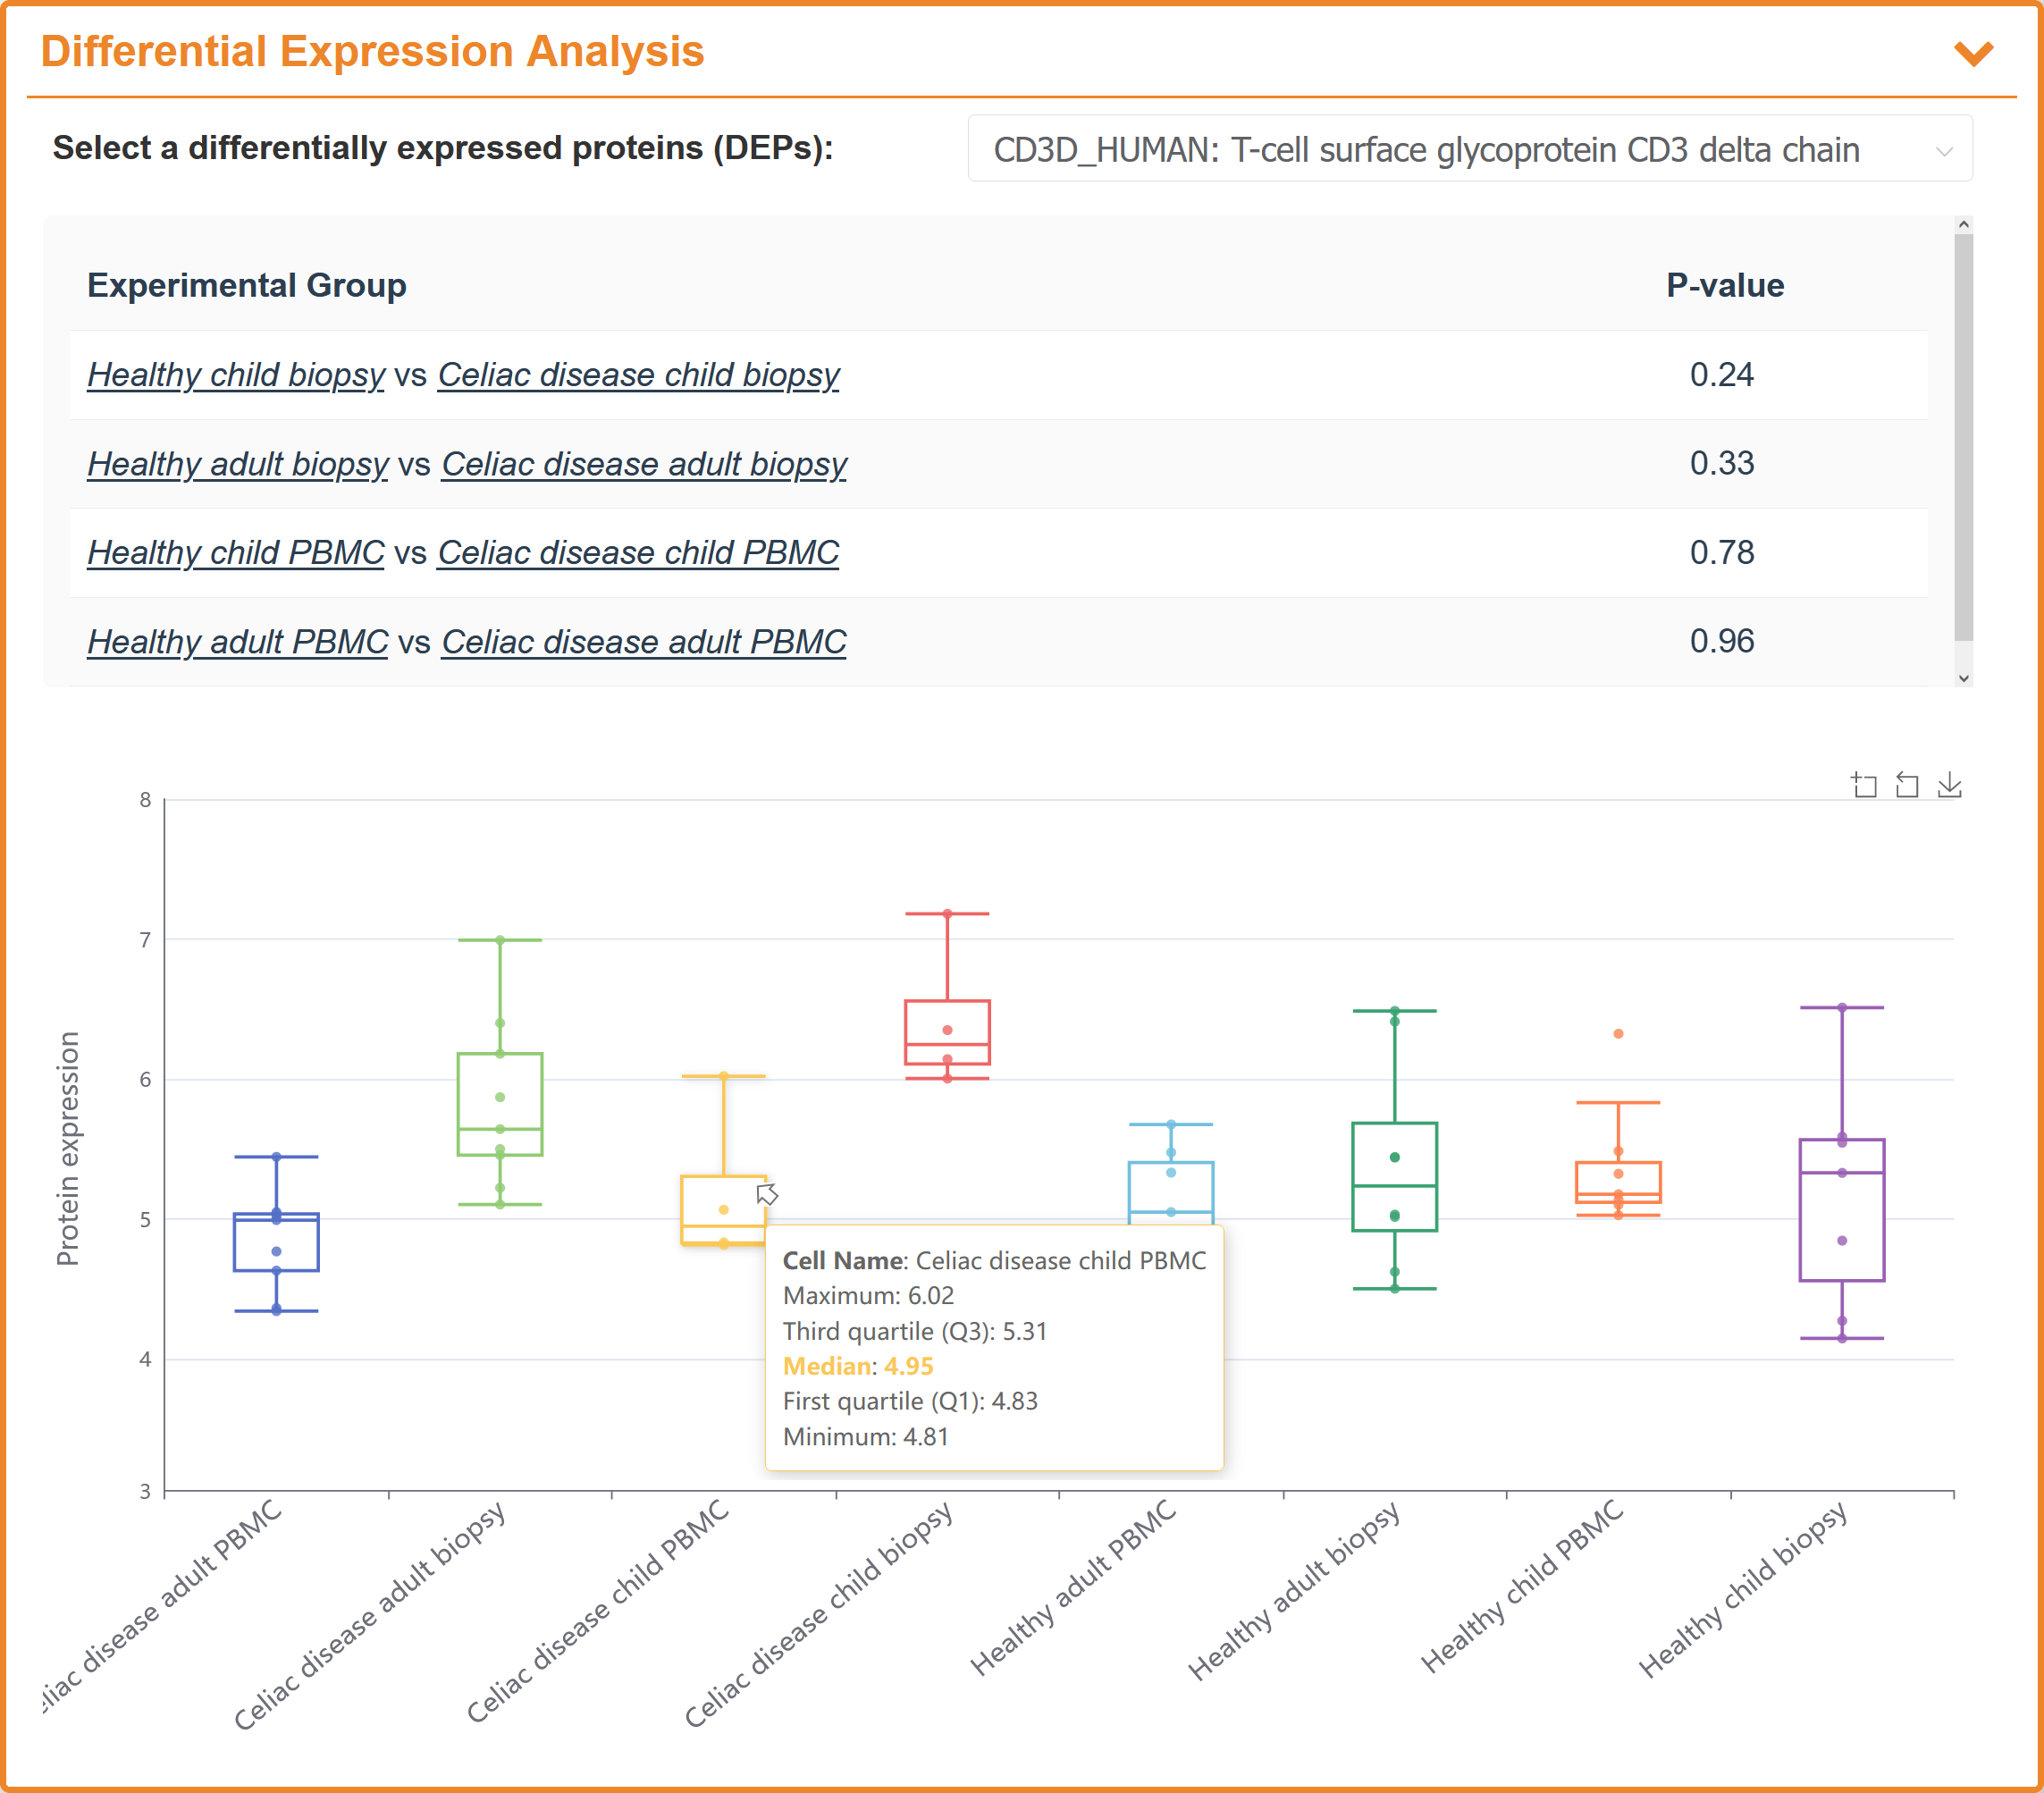
The expression-analysis section visualizes variations in measured proteins among study groups. Users can select a protein from the staining panel, and the interface reports the selected protein's distribution and the p-value for comparisons between two groups.
3.2. Description of mass spectrometry-based single-cell proteomics
3.2.1. General information for MS-SCP
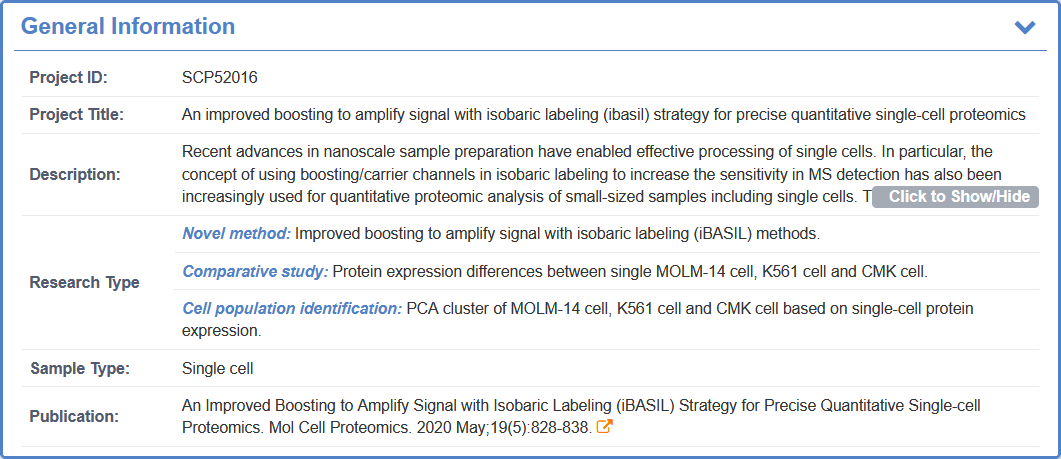
For each MS-SCP project, the General Information section provides the project ID, project title, description, research type, sample type, and a publication link to the original article.
3.2.2. Description of biological samples and experimental procedure for MS-SCP
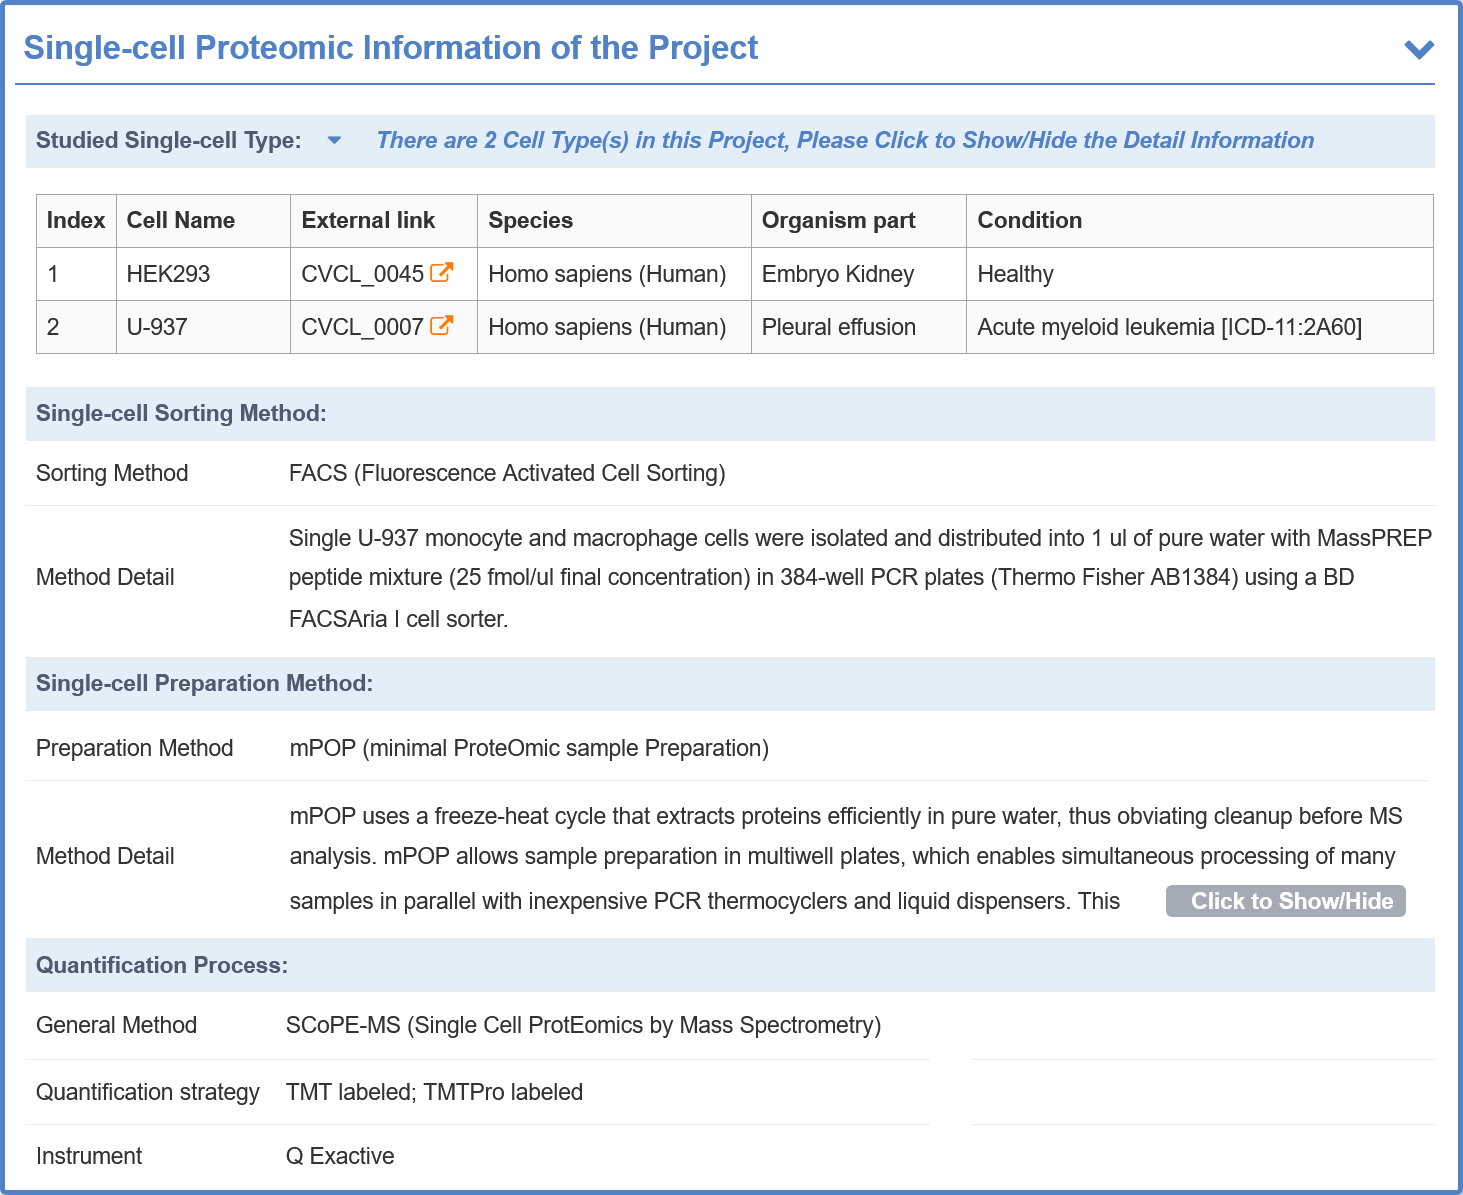
The following is a detailed description of the experimental process. A typical SingPro page describing quantification process for mass spectrometry-based SCP. Each page is carefully organized to four sections: Studied Single-cell Type (studied species, cells, pathological/physiological condition, etc.), Sorting Method (method name & its application detail), Preparation Method (method name & its application detail), and Quantification Process (applied quantification approach, quantificiation strategy, experimental platform, etc.).
3.2.3. Protein expression differences of MS-based SCP
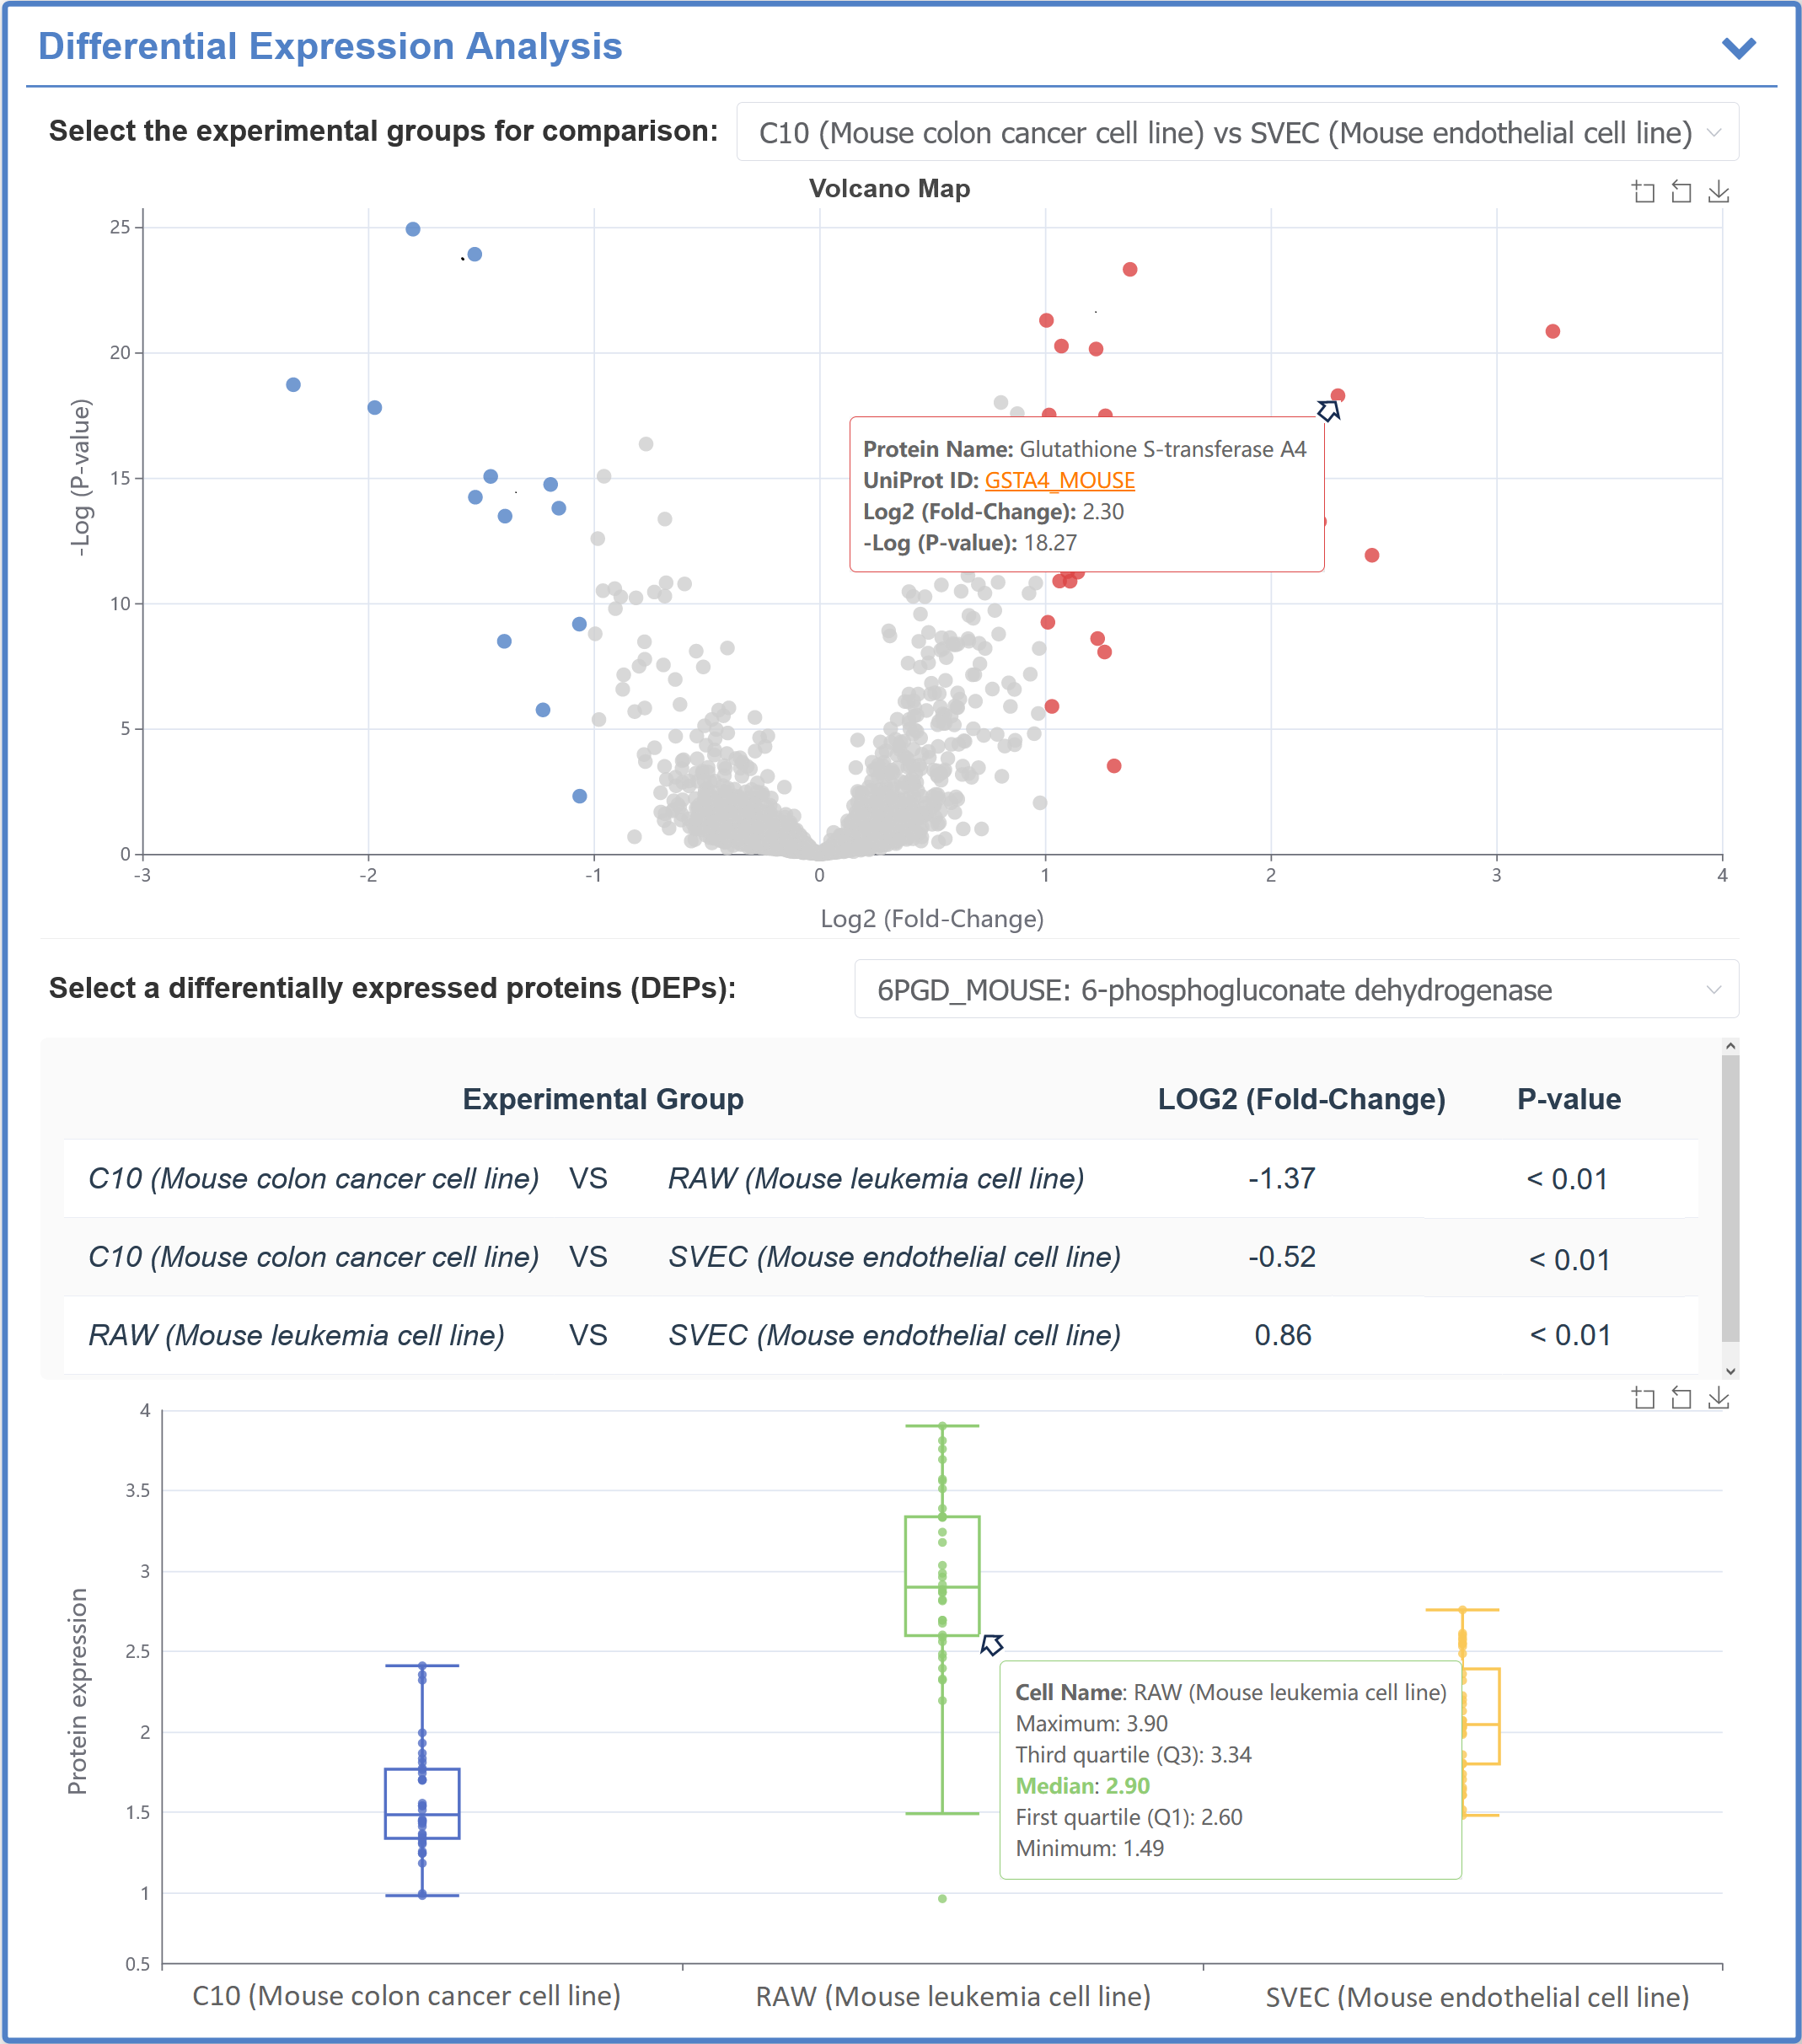
The MS-based expression-analysis page describes protein-expression variation among study groups. Particularly, the volcanic map between two groups is calculated to provide the differential expression profiles for proteins (the horizontal coordinate indicates the log2 fold change (Log2FC) and vertical one denotes log p-value (LogP); the proteins are colored in red and blue based on their Log2FC & p-value (Log2FC >1 & p-value <0.05 and Log2FC <-1 & p-value <0.05, respectively). The differentially expressed proteins can be selected, and the p-value of selected protein between two groups is calculated and provided.
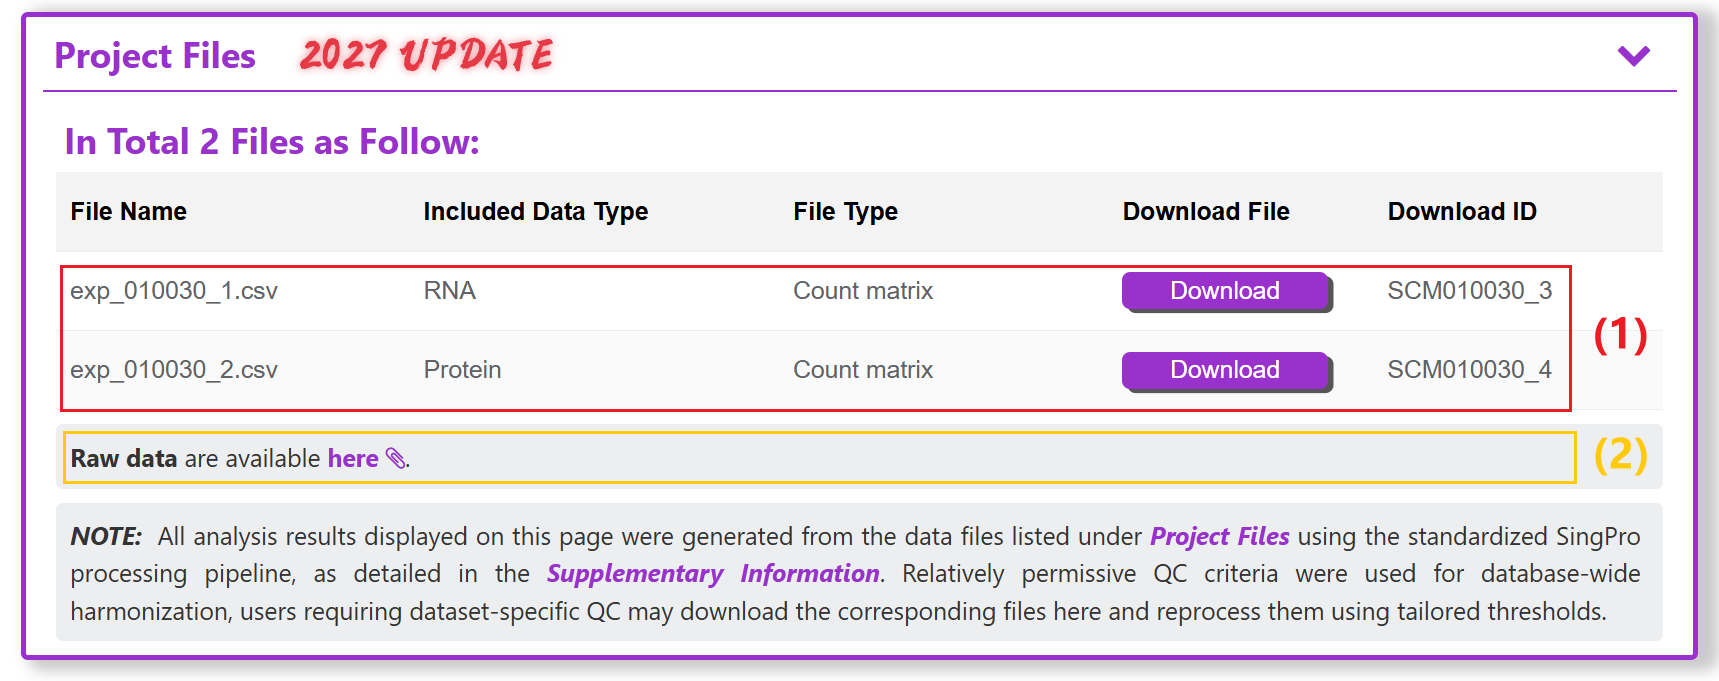
For SCM data, SingPro provides the modality-specific files and links to the available raw-data repository. Each downloadable file is accompanied by its displayed filename, original filename, included data type, file type, download link, and Download ID.
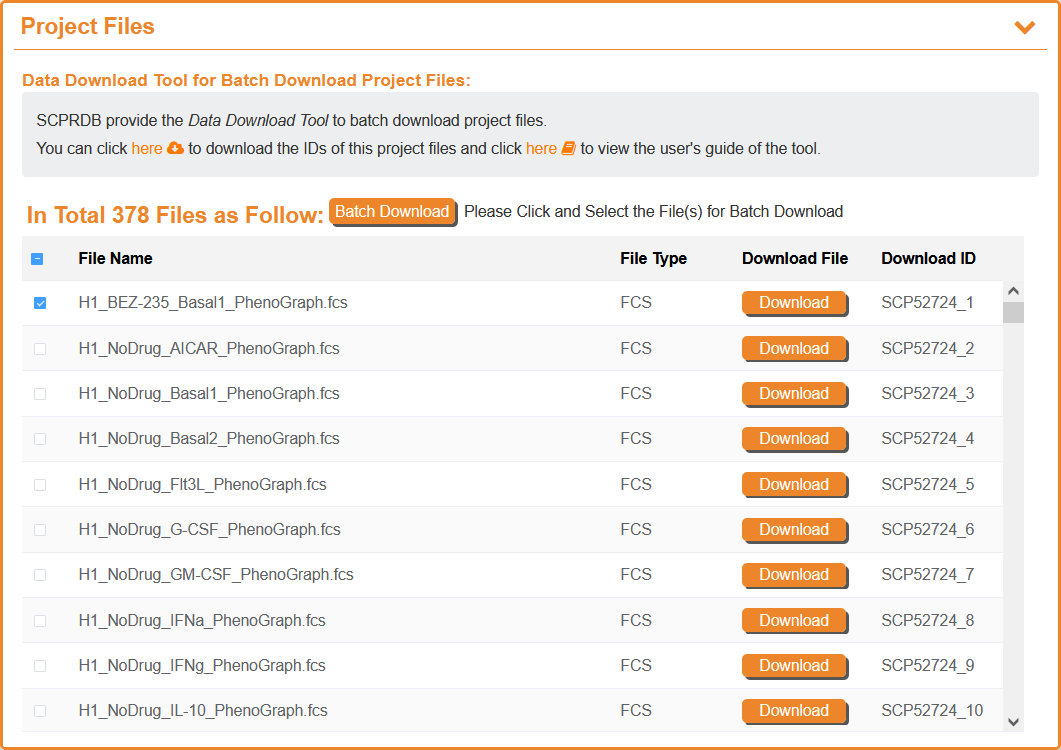
For FC-SCP data, SingPro provides raw files in FCS format together with metadata and the corresponding protein-detection panel. Users may download individual files with the Download button or use the batch-download tool available from the website.
For MS-SCP data, SingPro provides raw data and corresponding processed files, including metadata, FASTA, peak or result files where available. Every file has a Download ID.
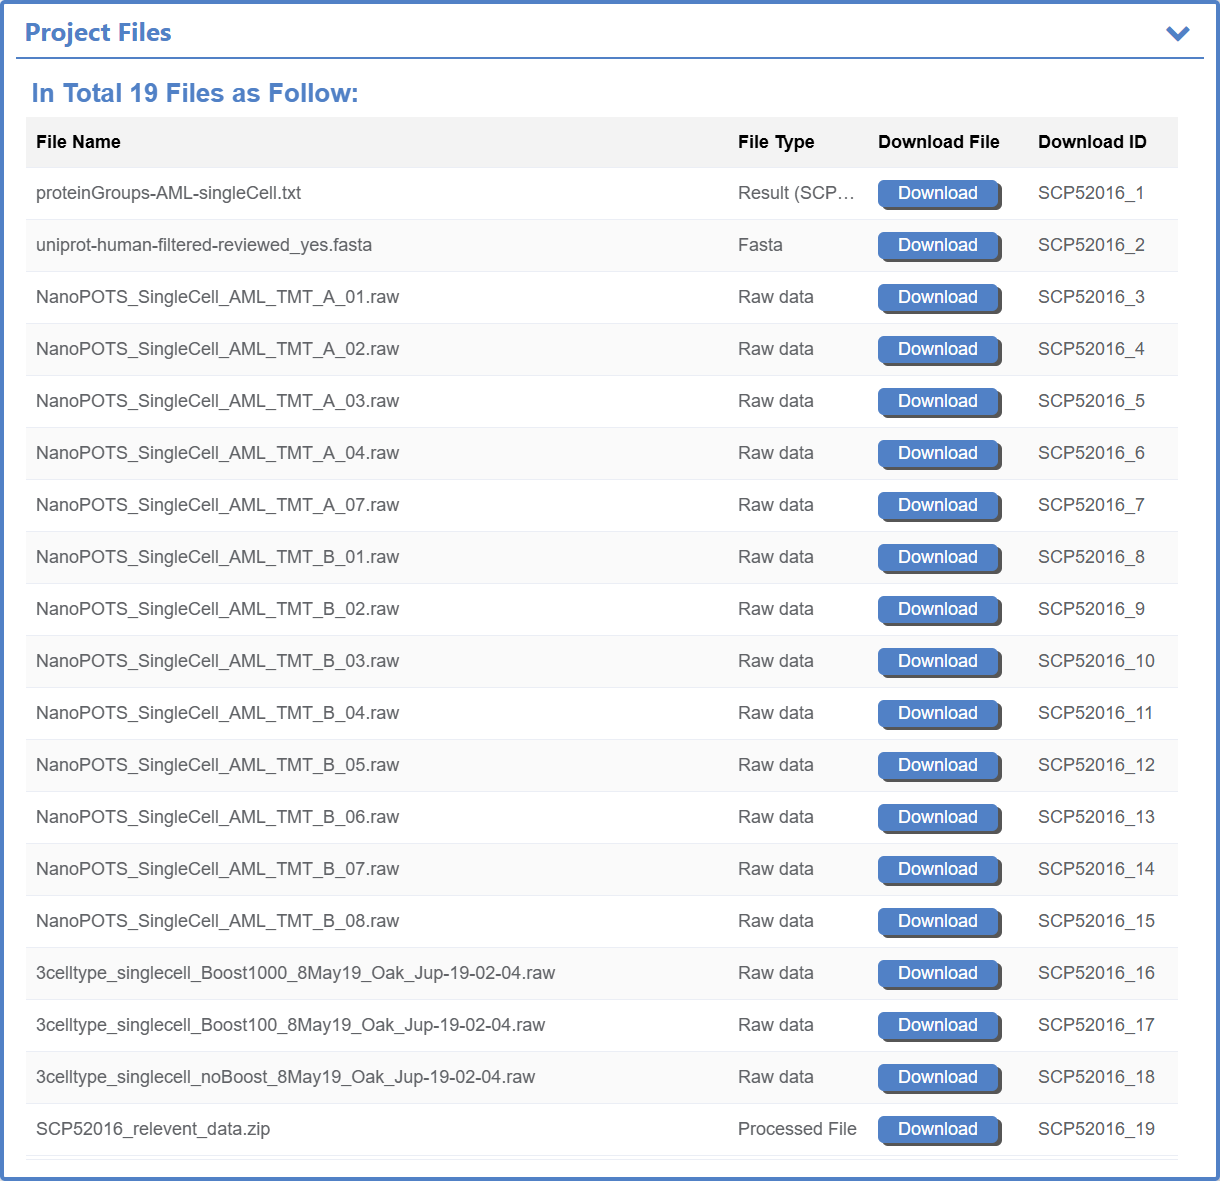
Users can download individual datasets by clicking the Download button or use the site's batch download tool. For more information, click here to view the batch download tutorial.
Any benefit derived from the use of a dataset made available through SingPro shall remain vested in the original author or data provider of that dataset.